Figures & data
Figure 1 Twenty core compounds of four herbs from Li-Da-Qian mixture.
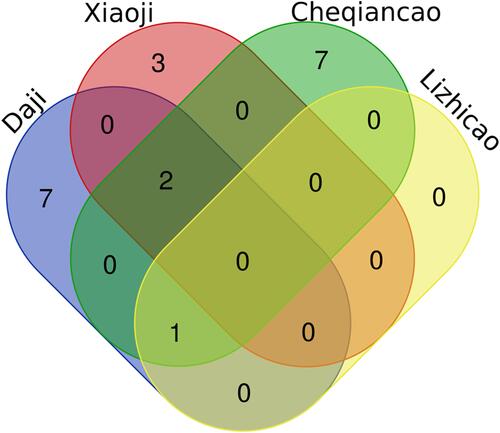
Table 1 Potential Targets of Li-Da-Qian Mixture Against Glomerulonephritis
Figure 2 The GO enrichment analysis of genes of Li-Da-Qian mixture against glomerulonephritis, including three domains: biological process (A), cellular component (B), and molecular function (C). The enrichment ration, size and color of the dots represent the degree of GO enrichment analysis.
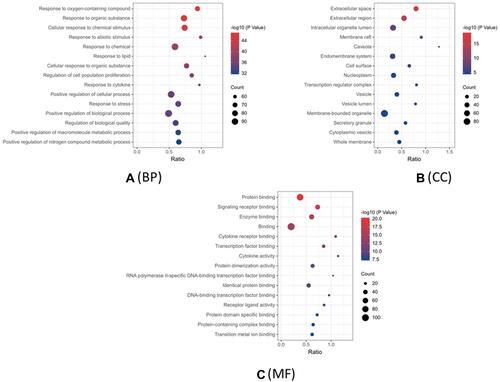
Table 2 KEGG Pathway Analysis of Li-Da-Qian Mixture in Treating Glomerulonephritis
Figure 3 The KEGG analysis of genes of Li-Da-Qian mixture against glomerulonephritis. Different colors represent different pathways. The size of red dots represents amounts of enriched genes.
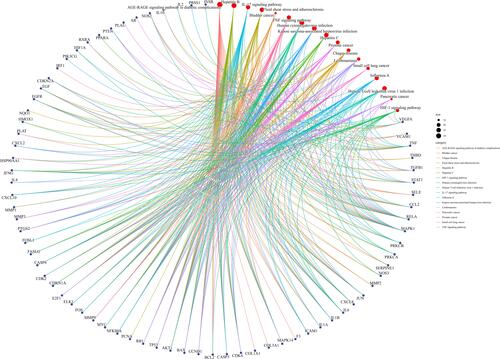
Figure 4 Drug targets network of Li-Da-Qian mixture. The potential target network of Li-Da-Qian is constructed using 20 compounds and 244 potential targets. Lines stand for the interactions between compounds and target nodes. A stands for MOL001735, which belongs to Daji, Cheqiancao and Lizhicao. B1 stands for MOL000359, which belongs to Daji, Xiaoji and Cheqiancao. B2 stands for MOL000449, which belongs to Daji, Xiaoji and Cheqiancao.
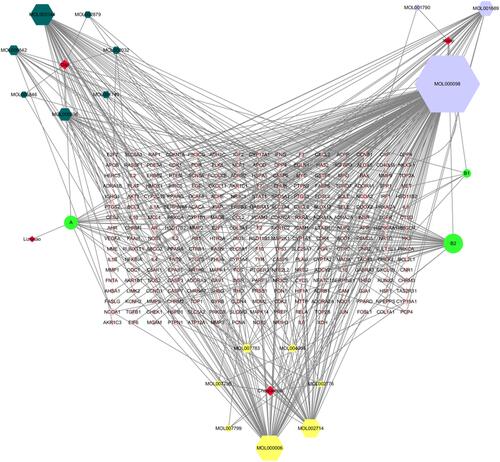
Figure 5 (A) PPI network of Li-Da-Qian mixture-glomerulonephritis genes. The network (A) contains 113 nodes and 1967 edges. Core genes have a higher degree and are positively correlated with node size and color depth, including, IL-6, VEGFA, EGF, MAPK1, MMP9, TP53, TNF, and (B–D) MCODE analysis of PPI network in (A). Cluster 5 (B) includes 52 nodes and 1068 edges, Cluster 5 (C) includes 3 nodes and 3 edges and Cluster5 (D) includes 6 nodes and 7 edges.
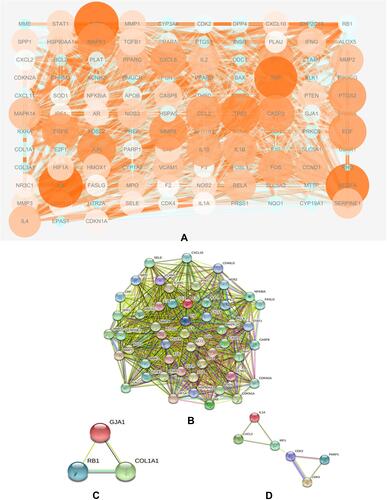
Figure 6 Continue.
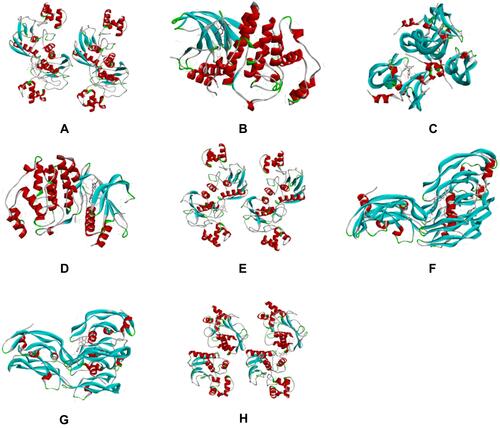
Figure 6 1. Virtual 3D docking of bioactive ingredients from Li-Da-Qian mixture for glomerulonephritis targets. The molecular docking of baicalein, luteolin and quercetin with MMP9 (A, E, H), MAPK1 (/, D, B) and VEGFA (G, F, C) is shown. 2. Virtual 2D docking of bioactive ingredients from Li-Da-Qian mixture for glomerulonephritis targets. The molecular docking of baicalein, luteolin and quercetin with MMP9 (A, E, H), MAPK1 (/, D, B) and VEGFA (G, F, C) is shown.
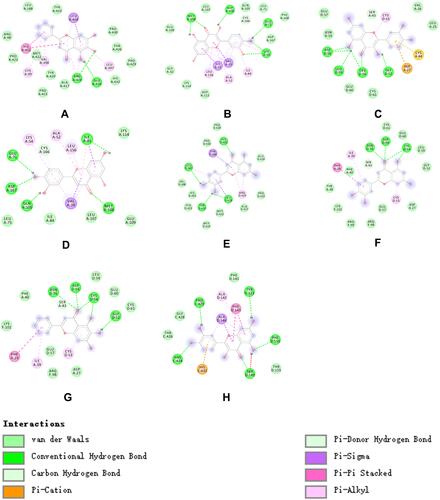
Table 3 Docking Results of Three Bioactive Ingredients from Li-Da-Qian Mixture for Glomerulonephritis Targets
Figure 7 Baicalein treatment protected from LPS-induced acute kidney injury. (A) Serum biochemical levels in mice (n=5–6) treated with different doses of baicalein after 24h LPS administration. (B) The inflammatory factors in the renal cortex of LPS-induced acute kidney injury model with or without different doses of baicalein (n=5–6). (C) Representative images of hematoxylin and eosin staining (magnification: ×200, scalebar: 50μm) of kidneys after 24h LPS administration. **p < 0.01, ***p < 0.001 versus the control group, #p < 0.05 versus the LPS group.
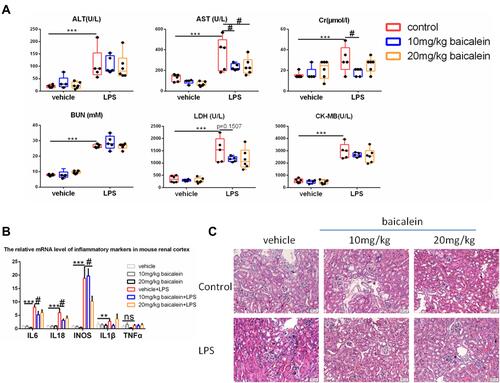
Figure 8 Effects of baicalein and luteolin treatment for LPS-induced glomerulonephritis by Western blotting and qPCR. Cells were grown on 6-well or 12-well plates until 60–70% confluence, pretreated with baicalein or luteolin for 2h, and sequentially stimulated with LPS (20μg/mL) for another 24 h. Western blotting results for baicalein therapeutic effect (A), densitometric analysis (B) and qPCR results for baicalein therapeutic effect (C and D). Western blotting results for luteolin therapeutic effect (E), densitometric analysis (F) and qPCR results for luteolin therapeutic effect (G and H). Protein results are shown as mean ± SEM (n = 3) and mRNA results are displayed as mean ± SEM (n=6). *p < 0.05, **p < 0.01, ***p < 0.001 versus the control group, #p < 0.05, ##p < 0.01, ###p < 0.001 versus the LPS group.
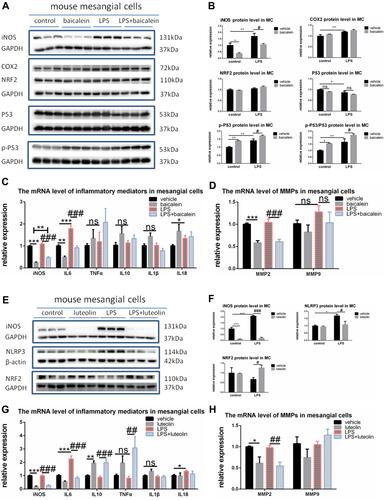
Figure 9 Effects of baicalein and luteolin treatment for TGFβ1-induced renal fibrosis by Western blotting and qPCR. Cells were grown on 6-well or 12-well plates until 60–70% confluence, pretreated with baicalein or luteolin for 2h, and sequentially stimulated with TGFβ1 (10ng/mL) for another 24 h. Western blotting results for baicalein therapeutic effect (A), densitometric analysis (B) and qPCR results for baicalein therapeutic effect (C). Western blotting results for luteolin therapeutic effect (D), densitometric analysis (E) and qPCR results for luteolin therapeutic effect (F). Protein and mRNA results are displayed as mean ± SEM (n=3). *p < 0.05, **p < 0.01, ***p < 0.001 versus the control group, #p < 0.05, ##p < 0.01, ###p < 0.001 versus the TGFβ1 group.
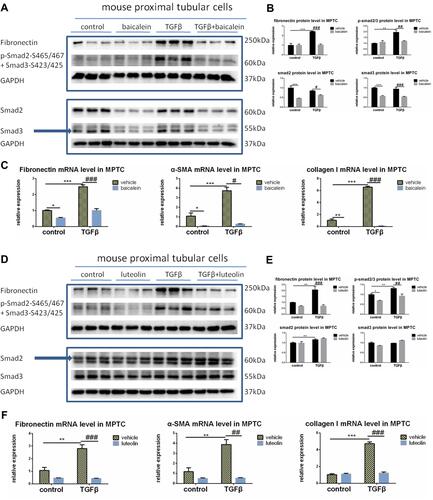
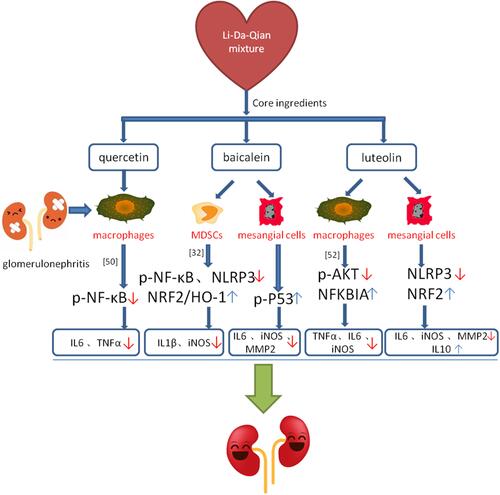
Figure 10 Possible mechanisms of Li-Da-Qian mixture core compounds on glomerulonephritis.