Figures & data

Figure 1 Schematic of the animal experiment design and process.
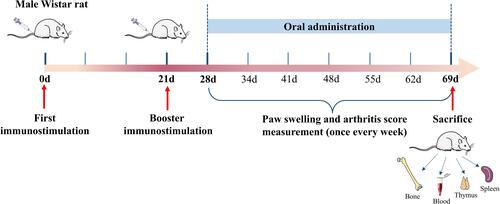
Table 1 Bioactive Peptides Identified from JTG
Figure 2 The total ions chromatography of JTG. (A) Peptide fraction; (B) protein fraction.
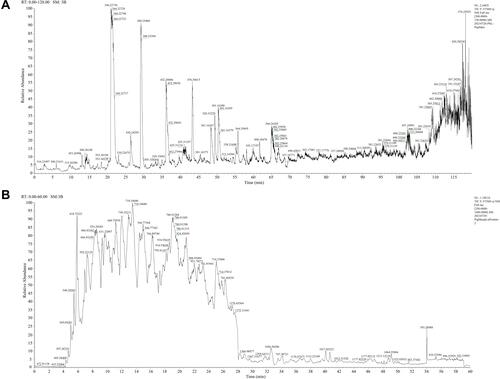
Figure 3 Bioinformatic analysis of the constituents in JTG: Molecular functions of peptides (A) and proteins (B); Biological process of peptides (C) and proteins (D).
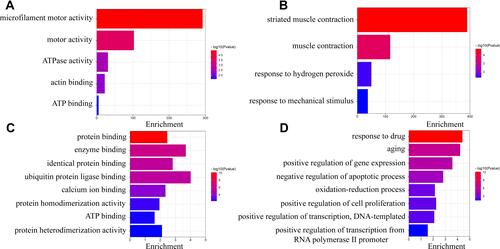
Figure 4 Effects of JTG on body weight, spleen and thymus in CIA rats. (A) Body weight; (B) Spleen index; (C) Thymus index. Data were expressed as the mean ± SD (n=10), #P < 0.05, ##P < 0.01 vs normal group; *P < 0.05, **P < 0.01 vs CIA model group.
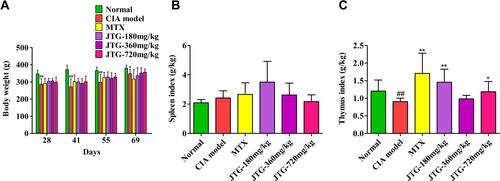
Figure 5 Effects of JTG on rheumatoid arthritis in CIA rats. (A) Pathological phenotype changes in CIA rats; (B) Paw swelling; (C) Arthritis score; (D) Serum IL-6 level; (E) Serum IL-1β level; (F) Histopathological changes of joints in CIA rats treated with JTG. The red arrow indicates cartilage hyperplasia and erosion; the black arrow indicates inflammatory cell infiltration; the blue arrow indicates the synovial hyperplasia; the green arrow indicates pannus formation. Data were expressed as the mean ± SD (n=10), ##P < 0.01 vs normal group; *P < 0.05, **P < 0.01 vs CIA model group.
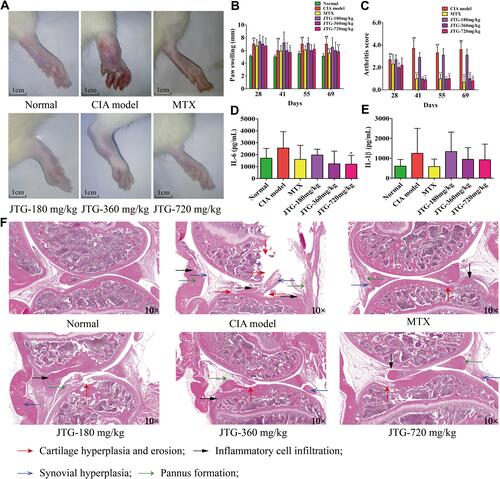
Figure 6 Effects of JTG on bone metabolism-related biochemical factors, bone tissue injury, bone morphology and bone micro-architecture in CIA rats. (A) Serum TRAP; (B) Serum RANKL; (C) Serum CTX-I; (D) Serum OCN; (E) Serum OPG; (F) Histopathological analysis of the bone tissue sections with Masson staining in CIA rats. The black arrow indicates articular cartilage, collagen and ossein; the purple arrow indicates muscle fiber and cellulose. Data were expressed as mean ± SD (n=10), #P < 0.05 vs normal group; *P < 0.05 vs CIA model group.
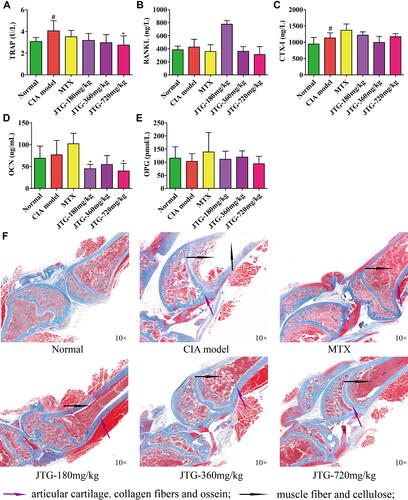
Figure 7 Effects of JTG on bone morphology and bone micro-architecture in CIA rats. (A) BMD; (B) BVF; (C) BS/BV; (D) Tb.Th; (E) Tb.N; (F) Tb.Sp; (G) 2D scanning images of the rat femur (can observe the density of bone trabecular); (H) 3D scanning images of the rat femur (can more intuitively observe the structure, density and morphology of bone trabecular.) Data were expressed as the mean ± SD (n=10), #P < 0.05, ##P < 0.01 vs normal group; *P < 0.05, **P < 0.01 vs CIA model group.
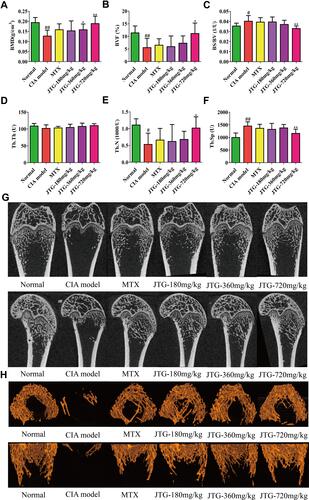
Figure 8 PCA score plot shows preliminary separation between serum samples and QC. (A) Positive ion mode; (B) negative ion mode.
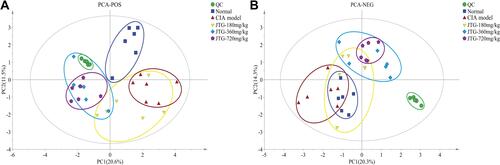
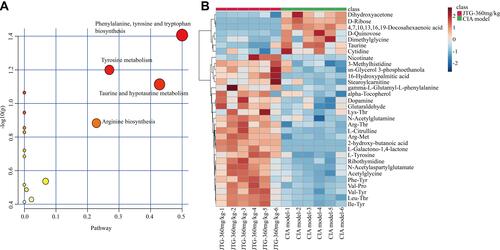
Figure 9 The analysis of UHPLC-Q/TOF-MS of serum samples of CIA rats. Statistical validation of the orthogonal partial least square discriminant analysis (OPLS-DA) model in 200 random permutation tests. Green dots are the R2 values and blue blocks are the Q2 values. Between normal and CIA model groups: (A) validation of OPLS-DA model in positive ion mode; (B) OPLS-DA score plot in positive ion mode; (C) an S-plot of the normal and CIA model groups. Between CIA model and JTG-360 mg/kg groups: (D) validation of OPLS-DA CIA model in positive ion mode; (E) OPLS-DA score plot in positive ion mode; (F) an S-plot of the CIA model and JTG-360 mg/kg groups.
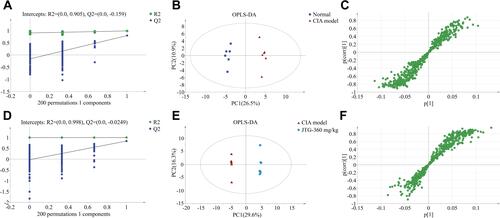
Table 2 Potential Biomarkers Identified in Rat Serum
Figure 10 The pathway impact prediction of MetaboAnalyst 5.0 online database between CIA model and JTG-360 mg/kg groups: (A) bubble diagram. Bubble color represents the P-value: deeper colors represent smaller P -values, indicating larger differences. The size of the bubble represents the impact of the pathway during topological analysis. Larger size represents a higher impact; (B) heat map of the differential metabolites in CIA model and JTG-360 mg/kg groups. Each cell in the heat map represents the fold change between the two groups: blue color represents the metabolite expression down-regulation, and red color represents the metabolite expression up-regulation.