Figures & data
Table 1 Correlation Between ARL14 Expression and Clinicopathological Characteristics in LUAD and LUSC
Table 2 Correlation Between ARL14 Expression and Clinicopathological Characteristics in 120 Patients with NSCLC
Figure 1 ARL14 expression in LUAD and LUSC. (A) ARL14 expression in LUAD tissues and normal samples. (B) ARL14 expression in LUAD tissues and paired normal samples. (C) ARL14 expression in LUSC tissues and normal samples. (D) ARL14 expression in LUSC tissues and paired normal samples.
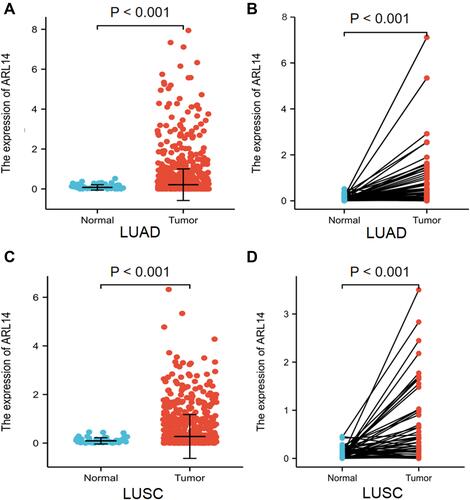
Figure 2 Correlation between ARL14 expression and clinicopathologic features in patients with LUAD and LUSC in TCGA database (P < 0.05). (A and B) The correlation between ARL14 expression and T stage (A) and pathologic stage (B) of patients with LUAD. (C–E) The correlation between the expression of ARL14 and age (C), N stage (D) and race (E) of patients with LUSC.
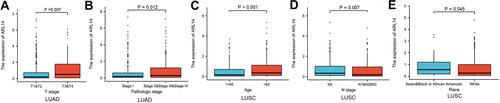
Figure 3 Kaplan–Meier curve for OS in LUAD and LUSC. (A) Kaplan–Meier analysis for ARL14 in LUAD; (B–F) Subgroup analysis for T3/T4, N1/N2/N3, M0, female, and R0 in LUAD. (G) Kaplan–Meier analysis for ARL14 in LUSC; (H–M) Subgroup analysis for age ≤65 years, smoker, T1/T2, N1/N2/N3, pathologic stage II/III/IV, and R0 in LUSC.
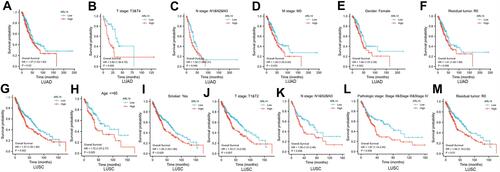
Table 3 Correlations Between Overall Survival and Expression of ARL14 Analyzed by Univariate and Multivariate Cox Regression in LUAD and LUSC
Figure 4 Nomogram for predicting probability of patients with 1-, 3- and 5-year OS. (A) Nomogram for predicting probability of patients with LUAD in TCGA database. (B) Nomogram for predicting probability of patients with LUSC in TCGA database.
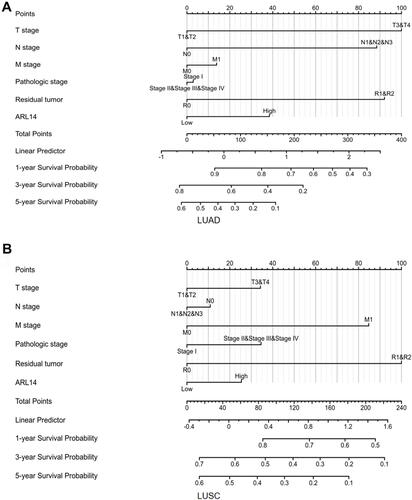
Figure 5 IHC staining and survival analysis of ARL14 in human NSCLC. (A) ARL14 expression of IHC on 120 human NSCLC tissues and 120 adjacent normal lung tissues. (B) Immunohistochemical staining for ARL14 expression in adjacent normal lung tissues (×400). (C) Immunohistochemical staining for low ARL14 expression in NSCLC tissues (×400). (D) Immunohistochemical staining for high ARL14 expression in NSCLC tissues (×400). (E) Kaplan–Meier plots of OS according to ARL14 expression. (F) Kaplan–Meier plots of PFS according to ARL14 expression.
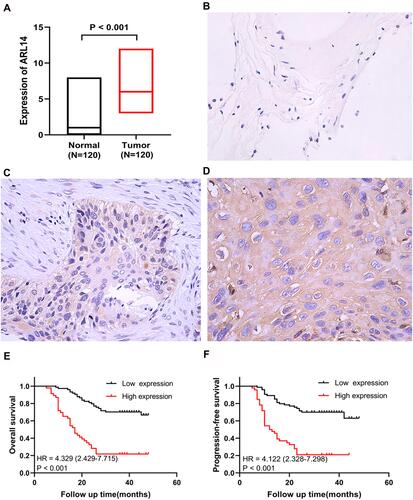
Table 4 Univariate and Multivariate Analyses of OS and PFS in 120 Patients with NSCLC
Figure 6 Correlation analysis of ARL14 in LUAD and LUSC. (A) Top 50 genes most positively associated with ARL14 in patients with LUAD were shown in a heatmap. (B) Top 50 genes most negatively associated with ARL14 in patients with LUAD were shown in a heatmap. (C) Top 50 genes most positively associated with ARL14 in patients with LUSC were shown in a heatmap. (D) Top 50 genes most negatively associated with ARL14 in patients with LUSC were shown in a heatmap. *p< 0.05; **p<0.001.
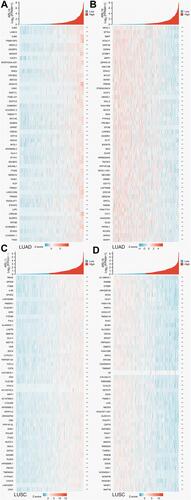
Figure 7 Enrichment analysis of ARL14 in LUAD and LUSC. (A–C) Significant Gene Ontology terms of the top 1200 genes most associated with ARL14 in LUAD, including BP, MF, and CC. (D) Significant KEGG pathways of the top 1200 genes most associated with ARL14 in LUAD. (E–G) Significant Gene Ontology terms of the top 1200 genes most associated with ARL14 in LUSC, including BP, MF, and CC. (H) Significant KEGG pathways of the top 1200 genes most associated with ARL14 in LUSC.
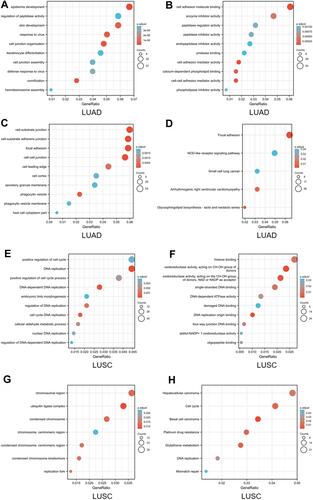
Figure 8 Enrichment plot from the GSEA. Enrichment plots of (A) keratinization, (B) systemic lupus erythematosus, (C) formation of the cornified envelope, (D) positive epigenetic regulation of RRNA expression, and (E) HDACS deacetylate histones in LUAD cases with high ARL14 expression. Gene set enrichment plots of (F) neutrophil degranulation, (G) signaling by interleukins, (H) NABA secreted factors, (I) class A1 rhodopsin like receptors, and (J) extracellular matrix organization in LUAD or LUSC cases with high ARL14 expression.
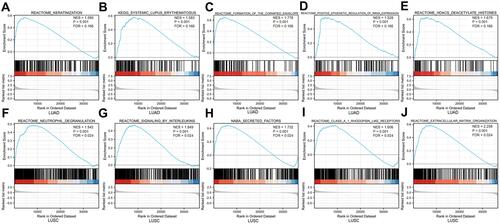
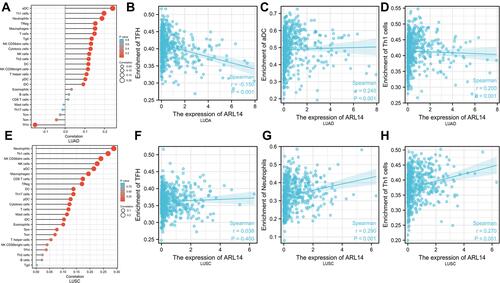
Figure 9 Correlation between immune cell infiltration and ARL14 in LUAD and LUSC. The forest plots showed the association between ARL14 expression and 24 immune cells in LUAD (A) and LUSC (E), respectively. (B) The relationship between ARL14 expression and TFH in LUAD. (C) The relationship between ARL14 expression and aDC in LUAD. (D) The relationship between ARL14 expression and Th1 in LUAD. (F) The relationship between ARL14 expression and TFH in LUSC. (G) The relationship between ARL14 expression and neutrophils in LUSC. (H) The relationship between ARL14 expression and Th1 in LUSC.