Figures & data
Table 1 Clinical Characteristics of Sepsis Patients and Healthy Controls
Table 2 Genotype and Allele Frequencies Distribution of the C5 Polymorphisms in the Sepsis Patients and Healthy Controls
Table 3 Genotype and Allele Frequencies Distribution of the C5 Polymorphisms in the Different Sepsis Status
Table 4 Genotype and Allele Frequencies Distribution of the C5 Polymorphisms in the 28-Day Surviving and Non-Surviving Sepsis Patients
Figure 1 The location of rs2269067 and rs17611 polymorphisms in C5 gene and their effect on 28-day survival of sepsis patients. (A) The human C5 gene is located on chromosome 9q34.1 (120,952,335–121,050,275) and contains 41 exons according to the GRCh38.p13 primary assembly. The green bar represents the exons. In the visual, the miss-sense rs17611 C>T polymorphism is located within the exon 19 of C5 gene and causes a V802I change in C5, while rs2269067 G>C polymorphism is located within the intron near to exon 30; (B and C) the effect of rs2269067 and rs17611 on the 28-day survival of sepsis patients was evaluated by Kaplan–Meier survival analysis; (D and E) the sepsis-related organ dysfunction assessment (SOFA) score in sepsis patients; (F and G) the correlation of C5 genetic polymorphisms with SOFA score in sepsis patients. Values of relative expression levels are shown as mean ± SD; ***P<0.001.
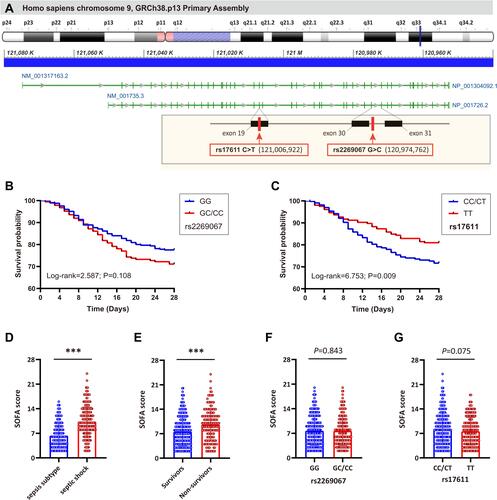
Figure 2 The influence of C5 genetic polymorphisms on C5 gene expression and C5a production in sepsis patients and healthy controls. (A and B) The C5 gene expression and C5a production levels in sepsis patients and healthy controls; (C and D) the C5 gene expression and C5a production levels in sepsis subtype and septic shock subgroups; (E and F) the C5 gene expression and C5a production levels in survivor and non-survivor subgroups; (G and H) the distribution of C5 and C5a expression in individuals with different rs2269067 genotypes; (I and J) the distribution of C5 and C5a expression in individuals with different rs17611 genotypes. Values of relative expression levels are shown as mean ± SD; *P<0.05, **P<0.01, ***P<0.001.
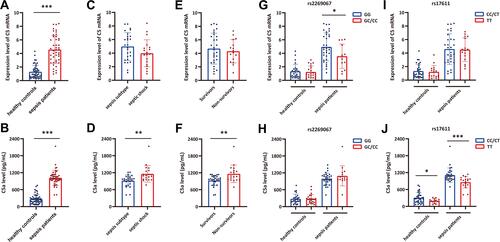
Figure 3 The influence of C5 genetic SNPs on inflammatory cytokine production in sepsis patients and healthy controls. (A–C) The IL-1β, TNF-α and IL-6 plasma levels in sepsis patients and healthy controls; (D–F) the IL-1β, TNF-α and IL-6 plasma levels in sepsis subtype and septic shock subgroups; (G–I) the IL-1β, TNF-α and IL-6 plasma levels in survivor and non-survivor subgroups; (J–L) the distribution of IL-1β, TNF-α and IL-6 plasma levels in individuals with different rs2269067 genotypes; (M–O) the distribution of IL-1β, TNF-α and IL-6 plasma levels in individuals with different rs17611 genotypes. Values of relative expression levels are shown as mean ± SD; *P<0.05, **P<0.01, ***P<0.001.
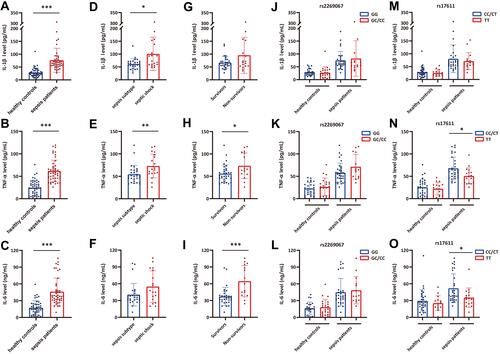
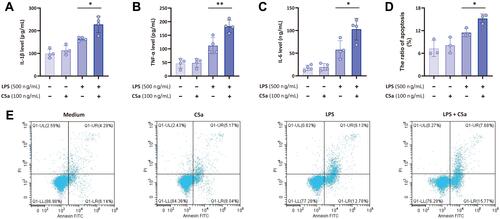
Figure 4 C5a enhances LPS-induced inflammatory cytokine production and cell apoptosis. THP-1 monocytes were stimulated with C5a (100 ng/mL), LPS (500 ng/mL), or C5a plus LPS for 16 h in vitro. (A–C) The supernatant concentrations of inflammatory cytokines (IL-1β, TNF-α and IL-6) were measured by ELISA; (D and E) the apoptosis of THP-1 monocytes stimulated with C5a, LPS, or C5a plus LPS was also measured by using annexin-V-FITC/PI staining on a flow cytometer. Values of relative expression levels are shown as mean ± SD; *P<0.05, **P<0.01.