Figures & data
Table 1 Clinical Characteristics of the Fifteen Patients Enrolled for RNA Sequencing
Figure 1 Schematic of the study workflow.
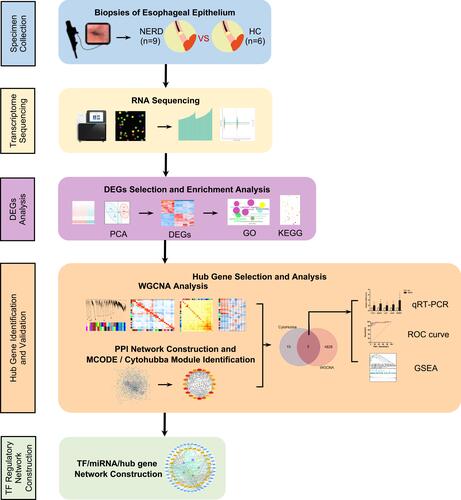
Figure 2 Analysis of RNA sequencing data. (A) PCA of sequencing data generated from biopsies of 9 patients with NERD and 6 HCs. (B) DEGs retrieved from sequencing data are illustrated in the clustered heatmap. Red in the heatmap denotes upregulation, while blue denotes downregulation. (C) The overall distribution of DEGs is depicted in a volcano plot.
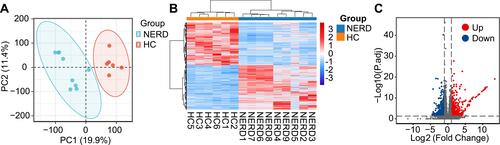
Figure 3 GO and KEGG enrichment analyses of DEGs. (A) Biological process (BP). (B) Cellular component (CC). (C) Molecular function (MF). (D) Heatmap of KEGG enriched terms colored by p-values.
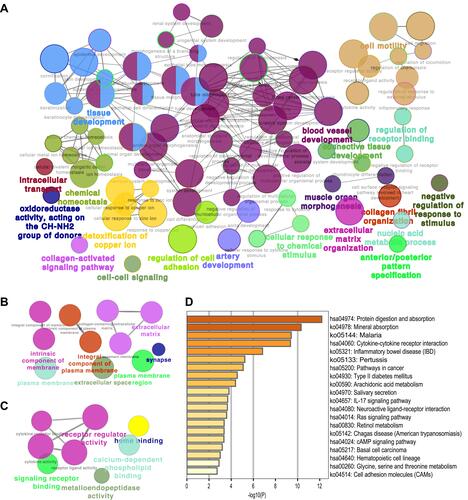
Figure 4 WGCNA. (A) Sample dendrogram and trait heatmap. (B) Analysis of the scale-free fit index for various soft-thresholding powers (left) and the mean connectivity for various soft-thresholding powers (right). (C) Clustering dendrogram of genes for GSE182974, together with the assigned module colors. (D) The module–trait association analysis revealed the highest association between the turquoise module and NERD.
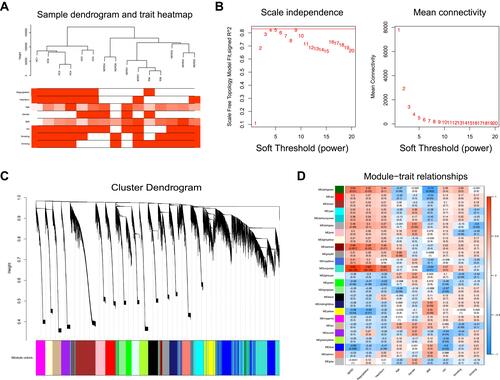
Figure 5 (A) PPI network of DEGs. (B) The top twenty hub genes were selected by the Stress algorithm of the Cytoscape plugin CytoHubba. The color indicates the score calculated by CytoHubba; higher scores are more red, and lower scores are more yellow. (C) Venn diagram shows the overlapping genes in the DEG–PPI network and WGCNA.
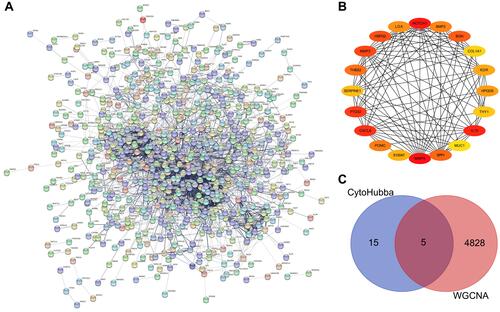
Figure 6 Validation and single-gene GSEA of hub genes. (A) qRT-PCR analyses of hub genes. n = 40 per group. Data were presented as mean ± SD. Statistical significance was calculated by two-tailed unpaired Student’s t-test (THY1, LOX, and KDR) and Mann Whitney test (BMP2 and MMP9), respectively. * P < 0.05. (B) ROC curve analyses of hub genes. AUC, area under the ROC curve. An AUC of 0.9–1.0 is considered to indicate excellent discrimination. GSEA of THY1 (C), BMP2 (D), LOX (E), KDR (F), and MMP9 (G).
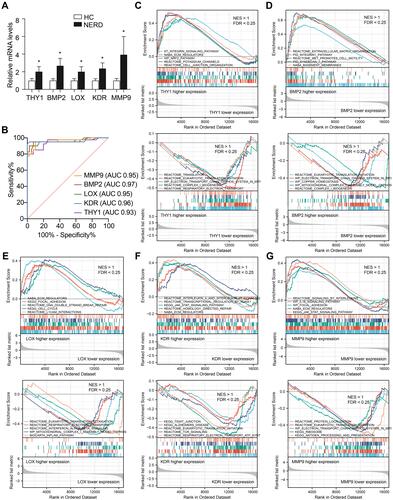
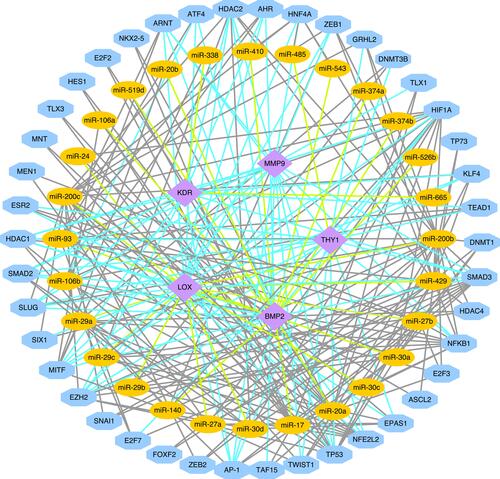
Figure 7 The TF/miRNA/hub gene regulatory network.