Figures & data
Figure 1 The flow chart of the present study. (A) The osteosarcoma inflammatory response-associated DEmRNAs were identified in GSE21257 and MSigDB databases. (B) The inflammatory response-associated gene signature was established through univariate and multivariate cox regression analyses. (C) The application of inflammatory response-associated gene signature in clinic and validation in Target database. (D) Identification and functional analysis of DEmRNAs related to inflammatory response-associated risk. (E) The association between immune infiltration and inflammatory response.
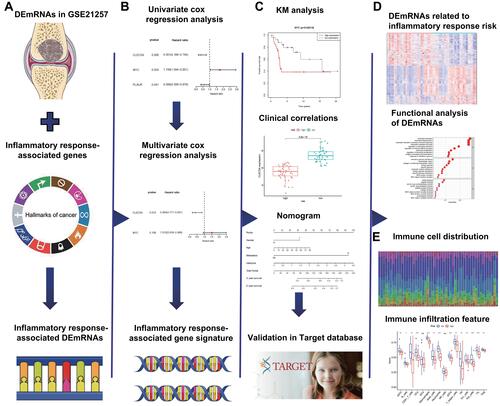
Table 1 The Inflammatory Response-Associated DEmRNAs in GSE21257
Figure 2 Identification of inflammatory response-associated DEmRNAs related to osteosarcoma metastasis. (A) DEmRNAs related to osteosarcoma metastasis in GSE21257 database. Red dots indicated up-regulated DEmRNAs (P < 0.05, FC > 1.5) and green dots indicated down-regulated DEmRNAs (P > 0.05, FC < −1.5). (B) Twenty-four inflammatory response-associated DEmRNAs were screened out in GSE21257 and MSigDB databases.
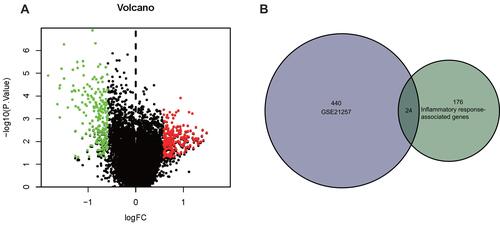
Table 2 The Multivariate Cox Regression Analysis of GSE21257
Figure 3 Construction and validation of the inflammatory response-associated prognostic signature in GSE21257 and Target datasets. (A) Three inflammatory response-associated prognostic genes were identified in univariate cox regression analysis. (B and E) Upper: The distribution and median value of risk scores in GSE21257 (B) and Target (E) datasets. Bottom: The scatter plot of patients’ risk scores and survival status in GSE21257 (B) and Target (E) datasets. (C and F) Kaplan-Meier survival plot of patients in high- and low-risk groups in GSE21257 (C) and Target (F) datasets. (D and G) Time-dependent ROC curve at 1, 3, and 5 years of inflammatory-associated prognostic signature in GSE21257 (D) and Target (G) datasets.
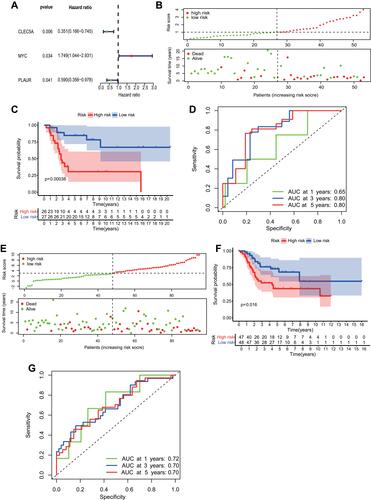
Figure 4 Relationships between inflammatory response-associated gene signature and clinical parameters in GSE21257. (A and B). Univariate and multivariate cox regression analyses revealed the risk score was the independent prognostic factor in GSE21257. (C–F). Boxplots of the relationship between CLEC5A expression and clinical characteristics. (G–J). The correlation between MYC expression and clinical characteristics.
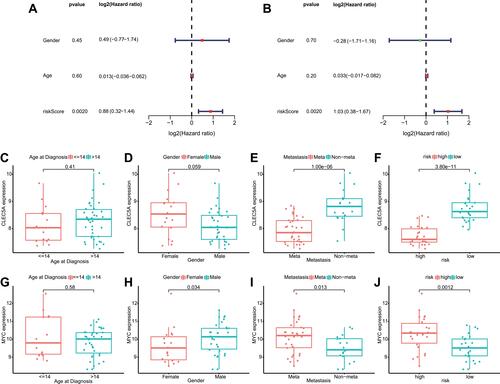
Figure 5 Establishment of the nomogram in GSE21257. (A) The nomogram predicted the 3- and 5-year survival risk in osteosarcoma patients. (B) The calibration curve of the 3-year survival. (C) The calibration curve of the 5-year survival.
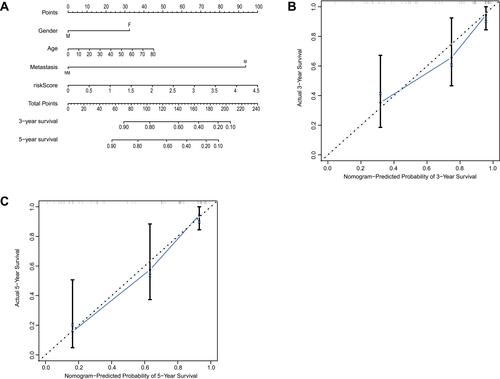
Figure 6 Identification and functional analyses of DEmRNAs related to inflammatory response-associated risks. (A) The heatmap of DEmRNAs associated with risk score in GSE21257. (B) The heatmap of risk score-associated DEmRNAs in Target dataset. (C) The overlapped DEmRNAs in GSE21257 and Target datasets. (D and E) The top 10 GO functional and top 30 KEGG pathway analyses of DEmRNAs.
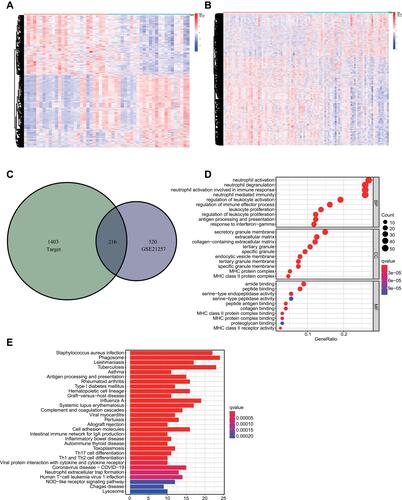
Figure 7 The relationships between inflammatory response and immune infiltration in GSE21257. (A) The correlation between risk score and immune score. (B). The relationship between risk score and stromal score. (C) The infiltrative proportion of 22 immune cells in osteosarcoma with statistically significant. (D) The correlations between risk scores and different immune cells. (E) The association between risk scores and different immune functions. (F) The overlapped immune cells and functions in GSE21257 and Target datasets. *P < 0.05; **P < 0.01; ***P < 0.001.
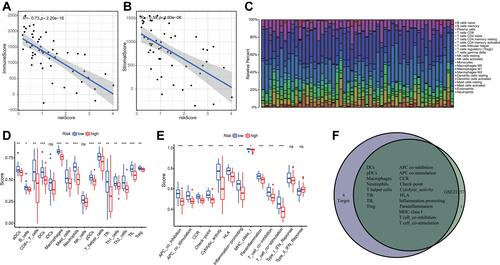
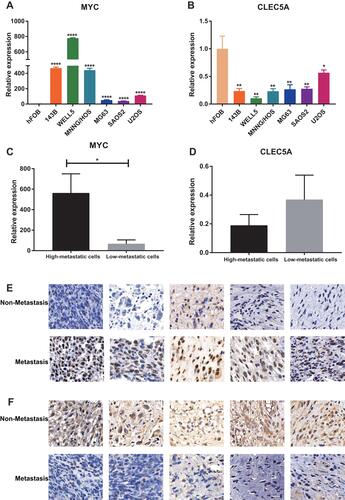
Figure 8 The expression of MYC and CLEC5A in cell lines and osteosarcoma patients’ samples. (A and B) The expression of MYC (A) and CLEC5A (B) in osteosarcoma and osteoblast cell lines. (C and D) The expression of MYC (C) and CLEC5A (D) in high- and low-metastatic cell lines. (E and F) The expression of MYC (E) and CLEC5A (F) in metastasis and non-metastasis patients, scale bar: 20μm. CLEC5A: C-type lectin domain family 5 member A; *P < 0.05; **P < 0.01; ****P < 0.0001.