Figures & data
Figure 1 (A) Immunologic correlation analysis of glomerular tissues in patients with DN; (B) Immunologic correlation analysis of renal tubular tissues in patients with DN; (C) Correlation analysis of differential immunocytes in the glomeruli of patients with DN; (D) For the tubules of patients with DN, with the correlation analysis of differential immunocytes.
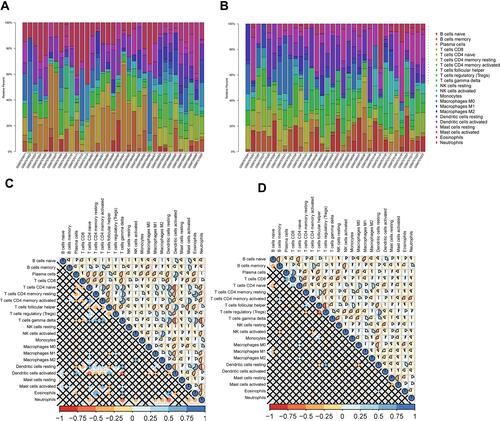
Figure 2 (A) xCell model of DN, kidney tissue data of GSE142025 was based on 64 immunocyte phenotypes to verify the expression of immune cells after DN; (B) Expression of many immune cells after DN.
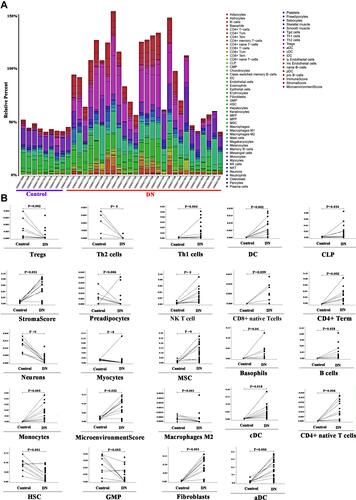
Figure 3 Identification of potential diagnostic biomarkers of DN.
Figure 4 (A) Intersection of differential genes in renal tubular tissues and hypoxia gene in human diseases in DN samples from GSE30122; (B) Enrichment and analysis of renal tubular differential gene and hypoxia intercross gene function; (C) Enrichment analysis of renal tubular differential gene and anoxic cross signal pathway; (D) Genetic Intersection of differential genes in renal globe tissue of DN patients in the GSE30122 sample and occurrence of hypoxia gene in human diseases in UniProt database; (E) Enrichment analysis of differential gene and hypoxia intersection signal pathway in renal gullet; (F) Enrichment analysis of renal tubular differential gene and anoxic cross signal pathway in which the HIF-1 signal pathway is the main enriched signal pathway of renal tubular differential gene (pink box).
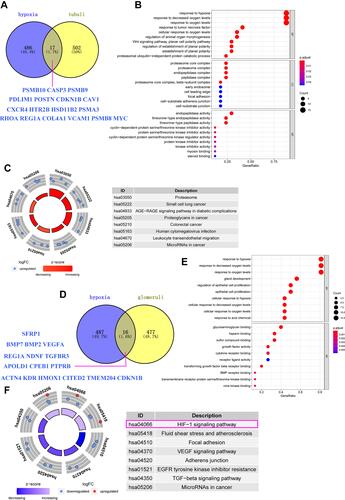
Figure 5 (A) Analysis of the relationship between hypoxia heterogeneity gene and immune cells in glomerular tissues of DN patients. (B) Analysis of the relationship between a hypoxic-heterogeneous gene in renal tubular tissues and immune cells in patients with DN.
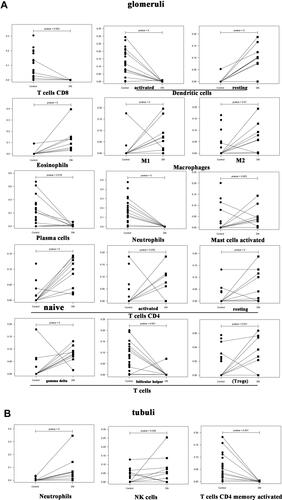
Figure 6 (A and B) Lasso regression analysis to screen the better genes for differential diagnosis of glomerular hypoxia in DN; (C) The GSE30122 data set was used to assess the accuracy of further diagnosis of glomerular hypoxia genes in patients with DN after screening with LASSO regression; (D) The experimental set was used to assess the accuracy of further diagnosis of glomerular hypoxia genes in patients with DN after screening with LASSO regression.
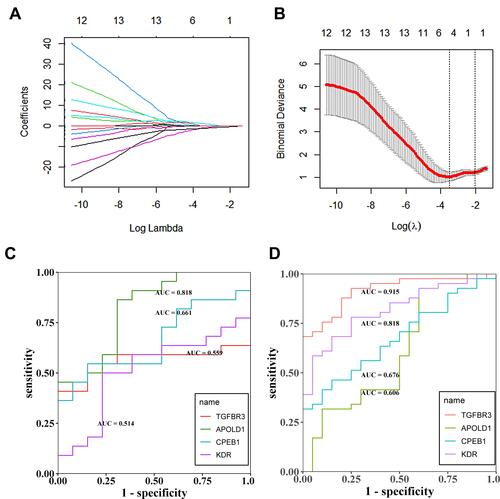
Figure 7 (A) ROC analysis of TGFBR3, APOLD1, CPEB1 and KDR in glomerular transcriptome data; (B–E) Corrected transcriptome expression of TGFBR3, APOLD1, CPEB1 and KDR; (F) ROC analysis of TGFBR3, APOLD1, CPEB1 and KDR in podocyte transcriptome expression data. *P<0.05; **P<0.01.
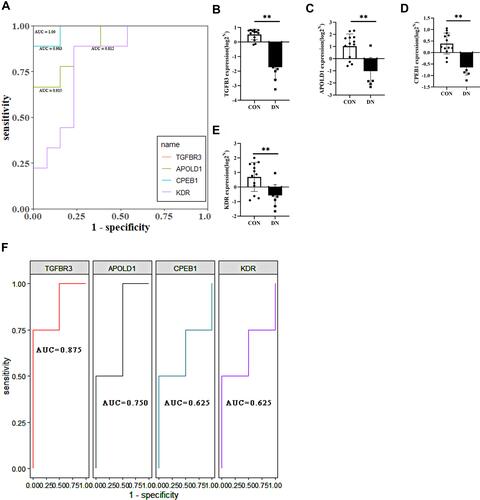
Figure 8 (A and B) Lasso regression analysis to screen the better genes for differential gene diagnosis of DN; (C) GSE30122 data set based on the further diagnostic accuracy of the gene for tubular hypoxia in patients with DN after screening by LASSO regression. (D) GSE96804 data set based on the further diagnostic accuracy of the gene for tubular hypoxia in patients with DN after screening by LASSO regression.
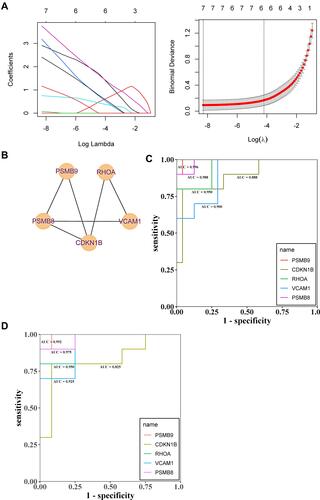
Figure 9 (A and B) PCA analysis of GSE99340 and GSE30529; (C) ROC analysis of PSMB8, PSMB9, RHOA, CDKN1B and VCAM1 in renal tubular transcriptome data; (D–H) Corrected transcriptome expression of PSMB8, PSMB9, RHOA, CDKN1B and VCAM1; (I–L) Corrected transcriptome expression of PSMB8, PSMB9, RHOA and CDKN1B in mesangial cell transcriptome expression data. *P<0.05; **P<0.01.
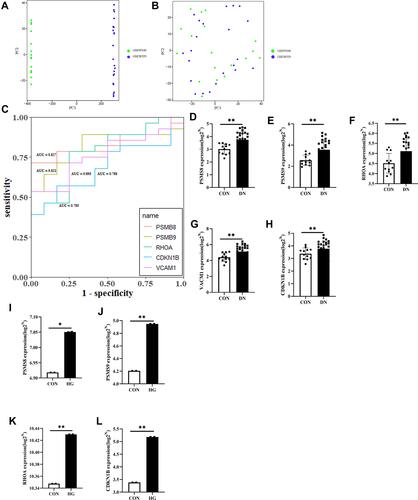
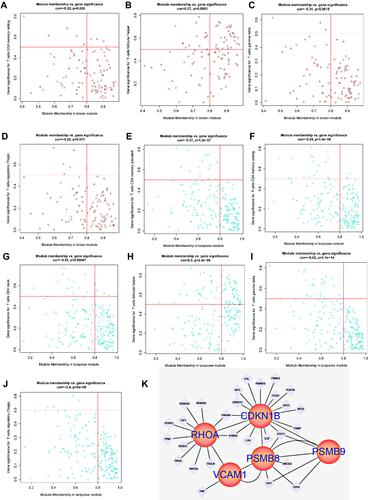
Figure 10 (A–D) Uses WGCNA to test the concentration of immune cells in glomeruli of DN; (E–H) WGCNA tests the concentration of immune cells in renal tubules of DN.
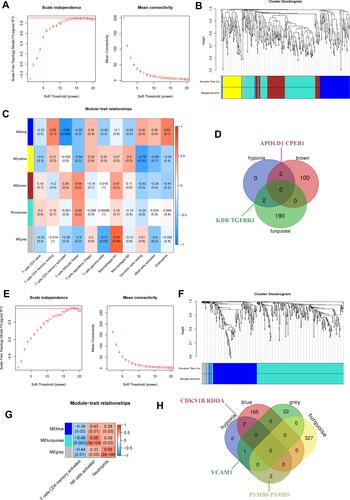
Figure 11 (A and B) Gene interaction of hypoxia-associated genes CDKN1B and RHOA in the blue module corresponding to T cell line; (C) Expression of hypoxia-associated genes VCAM1 in the grey module; (D–F) Gene expression of the T cell line corresponding to the cyan module of hypoxia-associated genes PSMB8 and PSMB9 in renal tubules; (G) Gene interaction of the T cell line corresponding to hypoxia-associated genes PSMB8, PSMB9, RHOA, VCAM1 and CDKN1B in renal tubules.
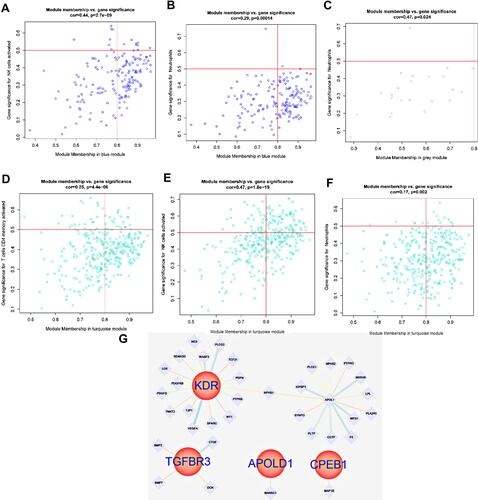
Figure 12 (A–D) Gene interaction of cell line corresponding to the brown module in the hypoxia-associated genes APOLD1 and CPEB1; (E–J) Expression of TGFBR3 and KDR-related T cell lines in the glomerulus, (K) Interaction of TGFBR3 and KDR related T cell lines in the glomerulus.