Figures & data
Table 1 Demographic and Clinical Characteristics of the Study Population in Group 1
Table 2 Demographic and Clinical Characteristics of IBD Patients in Group 2
Figure 1 Elevated fecal OSM and FC levels in IBD. The expression of fecal OSM (A) and FC (B) in HC, DC, and IBD. (C) ROC curves of fecal OSM and FC in discriminating IBD from controls. Fecal OSM (D) and FC levels (E) in CD and UC. (F) The ROC curve of fecal OSM to identify IBD subtypes. In all panels, *P < 0.05, **P < 0.01, ****P < 0.0001.
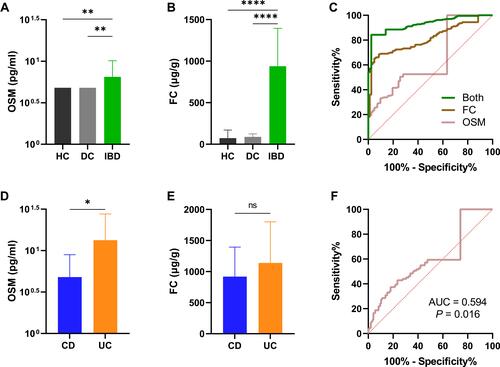
Figure 2 Correlations of fecal OSM and FC with clinical activity. The expression of fecal OSM in CD (A), UC (B), and combined CD and UC patients (C) classified by HBI or pMS. The expression of FC in CD (D), UC (E), and combined CD and UC patients (F) classified by HBI or pMS. The expression of fecal OSM (G) and FC (H) in IBD patients with and without clinical remission. (I) ROC curves of two fecal biomarkers to identify clinical remission. *P < 0.05, **P < 0.01, ***P < 0.001, ****P < 0.0001.
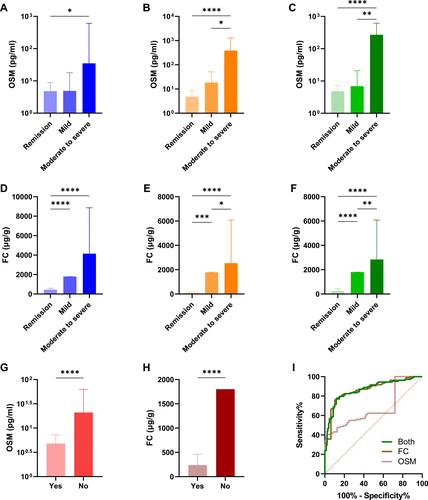
Figure 3 Correlations of fecal OSM and FC with endoscopic activity. Spearman correlation of fecal OSM (A) and FC expression (B) with SES-CD. Spearman correlation of fecal OSM (C) and FC expression (D) with MES. Fecal OSM (E) and FC levels (F) in IBD patients with and without mucosal healing. (G) ROC curves of two fecal biomarkers to identify mucosal healing. **P < 0.01, ****P < 0.0001.
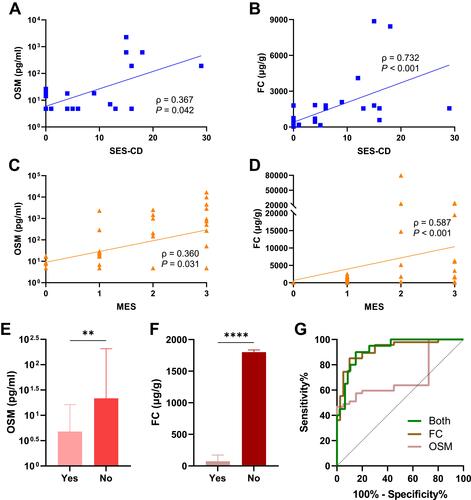
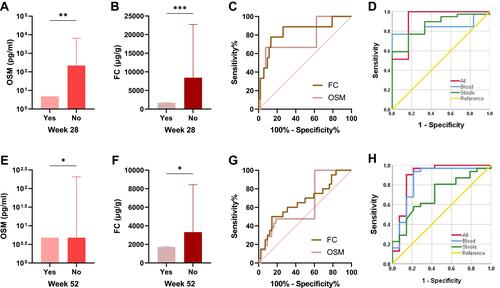
Figure 4 Elevated fecal OSM and FC levels in therapeutic non-responders. Baseline fecal OSM (A) and FC levels (B) in predicting therapeutic response at week 28. (C and D) ROC curves of fecal and blood biomarkers to predict therapeutic response at week 28. Baseline fecal OSM (E) and FC levels (F) in predicting therapeutic response at week 52. (G and H) ROC curves of fecal and blood biomarkers to predict therapeutic response at week 52. *P < 0.05, **P < 0.01, ***P < 0.001.