Figures & data
Figure 1 The effect of CCL4 inhibition on glucose homeostasis and systemic inflammation in HFD-induced DM mice. Body weights and blood sugar levels (n = 6; (A and B)). The oral glucose tolerance tests (OGTTs) and homeostasis model assessment of insulin resistance (HOMA-IR) were conducted after CCL4 antibody injections for 2 weeks (n = 6; (C and D)). ND represents normal diet mice; HFD represents HFD-induced DM mice. *P < 0.05, **P < 0.01.
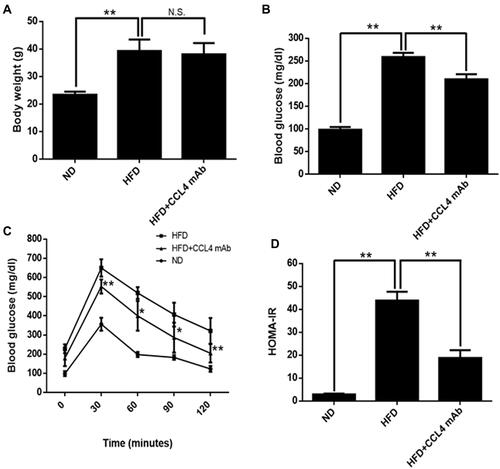
Figure 2 The effect of CCL4 inhibition on lipid parameter and systemic inflammation in HFD-induced DM mice. Serum total cholesterol (TC), triglycerides (TG), and non-high-density lipoprotein (HDL) levels (n = 6; (A–C)). Serum tumor necrosis factor (TNF)-α and interleukin (IL)-6 levels (n = 6; (D and E)). ND represents normal diet mice; HFD represents HFD-induced DM mice. **P < 0.01.
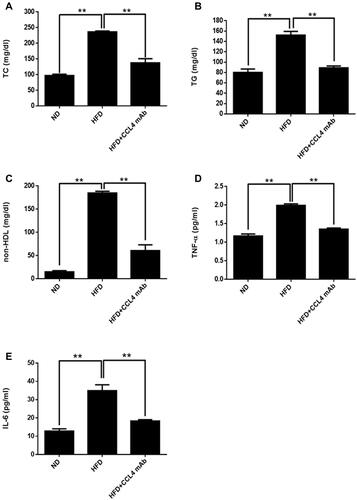
Figure 3 The effect of CCL4 inhibition on the structure of gut microbiota in HFD-induced DM mice. The α-diversity of gut microbiota (P = 0.025; n = 6; (A)). Principal coordinate analysis (PCoA) of β-diversity based on unweighted UniFrac analysis. Samples collected from different groups are labeled with different shapes and colors. HFD-induced DM mice are shown as red circles; HFD-induced DM mice with CCL4 antibody injection for 4 weeks group are shown as blue diamonds (n = 6; (B)). Composition difference analysis based on unweighted UniFrac analysis (P = 0.022; n = 6; (C)). HFD represents HFD-induced DM mice. *P < 0.05.
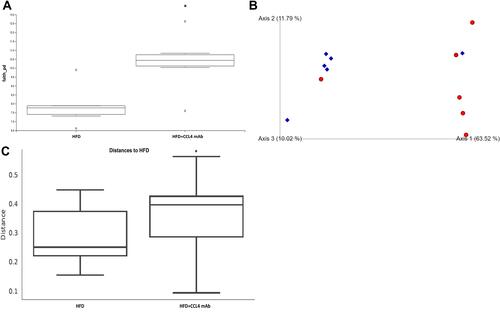
Figure 4 The effect of CCL4 inhibition on the composition of gut microbiota in HFD-induced DM mice. The relative abundances of dominant bacterial phyla (n = 6; (A)) and families (n = 6; (B)) in the HFD-induced DM group and HFD-induced DM mice with CCL4 antibody injection for 4 weeks group. ANCOM Volcano Plot of differential abundance. The red spot indicates family Muribaculaceae (n = 6; (C)). HFD represents HFD-induced DM mice.
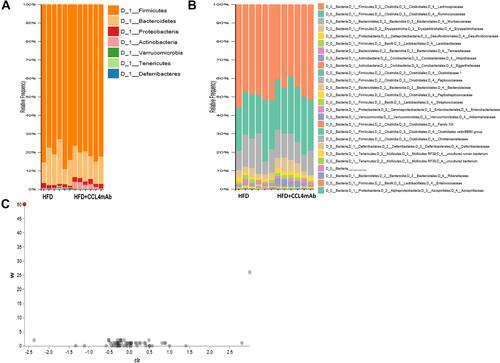
Figure 5 The effect of CCL4 inhibition on the gut microbiota and TMAO levels in HFD-induced DM mice. Family tree and heatmap (the relative abundances of 50 key taxa) analysis between gut microbiota and CCL4 inhibition in HFD-induced DM mice (n = 6; (A and B)). Serum levels of TMAO (n = 6; (C). *P < 0.05).
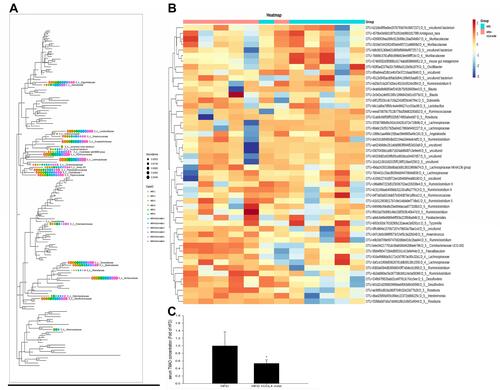
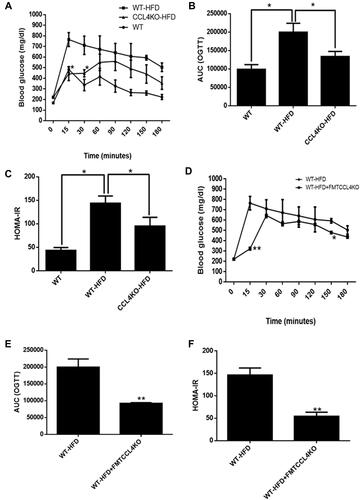
Figure 6 The effect of FMT from CCL4-deficient mice on glucose homeostasis in HFD-induced DM mice. The OGTTs, AUCs, and HOMA-IR were evaluated in both wild-type mice and CCL4 knockout mice fed an HFD (n = 6; (A–C)). The OGTTs, AUCs, and HOMA-IR were confirmed in HFD-induced DM mice with or without the FMT from CCL4 knockout mice (n = 3; (D–F)). WT represents wild-type mice; HFD represents HFD-induced DM mice; CCL4KO represents CCL4 knockout mice; FMT represents fecal microbiota transplant. *P < 0.05, **P < 0.01.