Figures & data
Table 1 Demographics for Participants Sampled for NGS and Patients from GSE8056
Figure 1 Characterization of plasma exosomes from burn patients and control group. (A) Visualized exosomal morphology in transmission electron microscopy (TEM). Scale bar = 200 nm. (B) Size distribution of plasma exosomes by nanoparticle tracking analysis (NTA). (C) Western blotting (WB) analyses of the exosome protein marker CD63 and the endoplasmic reticulum protein marker Calnexin.
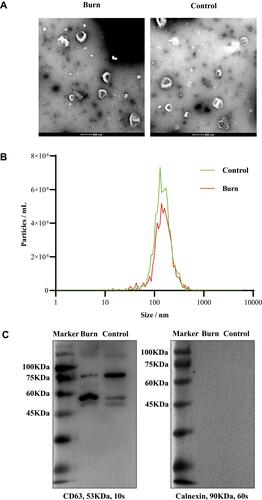
Table 2 Genome Alignment Ratios of RNA Read Counts Concerning Plasma Exosome-Derived Small RNAs
Table 3 Differentially Expressed microRNAs (DEMs) in Plasma Exosomes at the Early Burn Stage
Figure 2 DEMs in plasma exosomes and DEGs in skin. (A) 85 DEMs identified from NGS of plasma exosomal small RNAs, including 14 downregulated miRNAs in green and 71 upregulated miRNAs in red, are exhibited in the volcano plot. (B) Heatmap of all DEMs with the intensity plot showing a relatively low expression in green and a relatively high expression in red. (C) 1861 DEGs identified from microarray data of skin gene expressions (GSE8056), including 1030 downregulated genes in green and 831 upregulated genes in red, are exhibited in the volcano plot. (D) Heatmap of top 100 DEGs with greatest significance, with the intensity plot showing a relatively low expression in green and a relatively high expression in red.
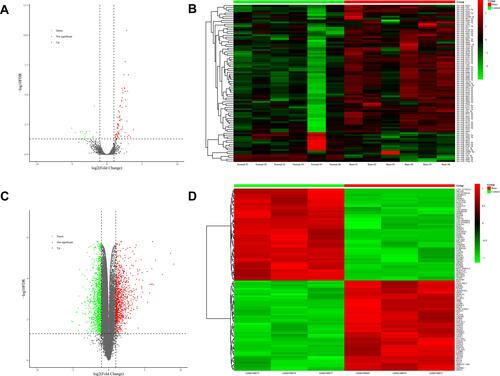
Figure 3 GO terms and KEGG pathways enriched in DEMs’ target genes, DEGs and focus genes. (A) Top 10 GO terms enriched in target genes of plasma exosome-derived DEMs. (B) Top 10 KEGG pathways of DEMs’ target genes. (C) Top 10 GO terms enriched in DEGs of skins (from GSE8056). (D) Top 10 KEGG pathways of DEGs. (E) Top 10 GO terms enriched in the focus genes. (F) All 7 KEGG pathways of the focus genes.
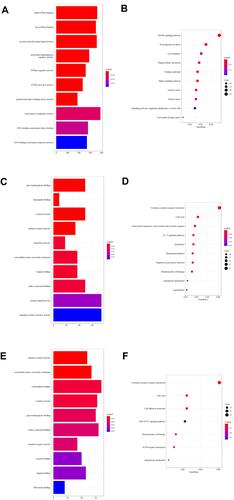
Figure 4 Venn analysis of DEMs’ target genes and DEGs. Up/down DEGs, differentially expressed genes significantly upregulated/downregulated in thermally injured skins from GSE8056. Up/down DEM targets, target genes of differentially expressed miRNAs significantly upregulated/downregulated in plasma exosomes from burn patients.
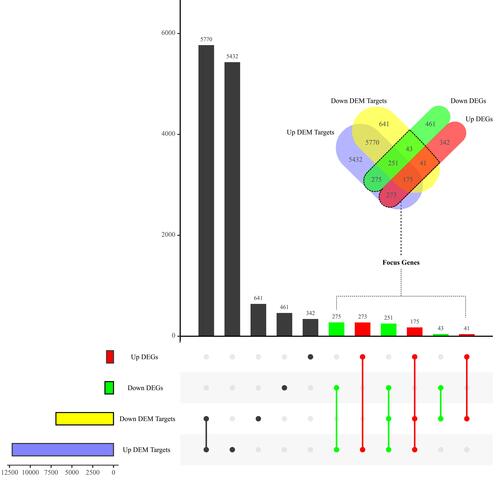
Table 4 Top 9 Hub Genes in the PPI Network of Focus Genes
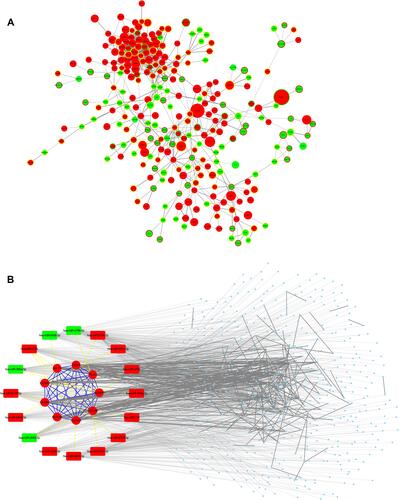
Figure 5 Networks of potential blood-to-tissue interactions. (A) The protein–protein interaction network of focus genes. Size of the node is scaled by | log2FC (fold change) | of gene expressions; color of the node and its border represents the expression regulation of mRNA and predicted upstream miRNA, respectively. (B) An integrated miRNA-mRNA and PPI network of the key miRNAs and their target genes (including 9 hub genes) in the focus genes. Edge line between genes (proteins) is solid; edge line between miRNA (round rectangle) and mRNA (round) is in dots. Red: upregulated. Green: downregulated.