Figures & data
Figure 1 Generation of nt-RORα-TMD and verification of its intranuclear delivery kinetics. (A) Structure of nt-RORα-TMD, nt-RORα-TMD (R42A/R43G) with mutated arginine 42 and 43, and RORα-TMD without Hph-1-PTD. (B) The identity of nt-RORα-TMD, nt-RORα-TMD (R42A/R43G), and RORα-TMD were confirmed by SDS-PAGE and Western blot after protein purification. (C and D) Jurkat T cells were treated with different concentrations of nt-RORα-TMD for 1 h (C) or with 1 μM of nt-RORα-TMD for the different periods (D), and the amount of the delivered protein inside the cells was analyzed by flow cytometry using anti-FLAG antibody. (E) The intracellular localization of nt-RORα-TMD was confirmed by confocal microscope using DAPI and anti-FLAG antibody. Scale bar = 10 μm (F) Jurkat T cells and mouse splenocytes were treated with nt-RORα-TMD or nt-RORα-TMD (R42A/R43G), and the cellular cytotoxicity was examined by CCK-8 analysis. The graphs are represented as mean ± SEM (n=3).
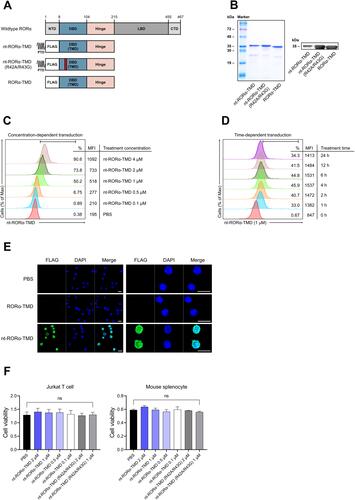
Figure 2 nt-RORα-TMD specifically suppressed IL-17A secretion through the inhibition of RORα-mediated transcription. (A and B) The competitive inhibition of nt-RORα-TMD over the endogenous RORα was examined by luciferase assay using HEK293 cells co-transfected with IL-17A promoter-luciferase vector and a vector expressing wild-type RORα (A) or a vector expressing wild-type RORγt (B). At 24 hours after the treatment of the transfected cells with nt-RORα-TMD or nt-RORα-TMD (R42A/R43G), the luciferase activity was measured by a luminometer. (C) Mouse splenocytes were activated with anti-CD3 and anti-CD28 antibodies in the presence of nt-RORα-TMD or nt-RORα-TMD (R42A/R43G), and the amount of IL-17A, IFN-γ, and IL-4 in the medium was measured by ELISA. (D) Mouse naïve CD4+CD62L+ T cells were isolated through MACS and activated with anti-CD3 and anti-CD28 antibodies treated in the presence of nt-RORα-TMD or nt-RORα-TMD (R42A/R43G). The level of CD69 or CD25 on the surface was analyzed by flow cytometry after 1 and 3 days of activation, respectively. The graphs are represented as mean ± SEM (n=3), *P<0.05, ***P<0.001.
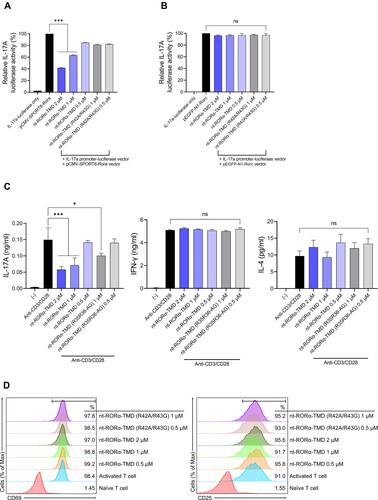
Figure 3 Specific inhibition of Th17 differentiation and the expression of Th17-related genes by nt-RORα-TMD. (A) Mouse naïve CD4+CD62L+ T cells were isolated and cultured in Th17-skewing condition in the presence of nt-RORα-TMD or nt-RORα-TMD (R42A/R43G). After 3 days of culture, T cells expressing RORγt and IL-17A were analyzed by flow cytometry using the corresponding mAb. (B and C) Naïve T cells were induced to differentiate into Th1, Th2 or iTreg cells under Th1-, Th2-, or iTreg-skewing condition in the presence of nt-RORα-TMD or nt-RORα-TMD (R42A/R43G), and T cells expressing the transcription factor specific to each T cell subset (B) and its representative cytokines (C) were analyzed by flow cytometry. (D and E) The gene expression profiles of Th17 cells treated with or without nt-RORα-TMD were analyzed by transcriptome sequencing. (D) The TPM counts of the signature genes were normalized and represented as a heatmap. (E) Enrichment plots based on immunologic signature gene sets were analyzed through gene set enrichment analysis (GSEA). The graphs are represented as mean ± SEM (n=3), ***P<0.001, ****P<0.0001.
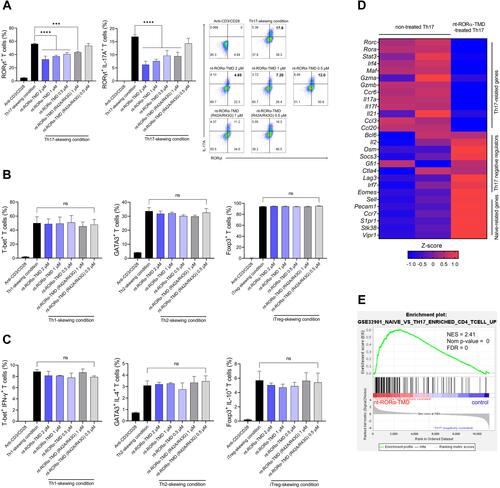
Figure 4 Therapeutic efficacy of nt-RORα-TMD in DSS-induced colitis mice. (A) Treatment scheme of DSS-induced colitis mice with PBS (for DSS group), anti-IL-17A antibody (100 μg/mouse), nt-RORα-TMD (100 or 20 μg/mouse) or nt-RORα-TMD (R42A/R43G) (100 μg/mouse). (B) The body weight of the mice was measured once daily. (C) The DAI score was calculated by measuring the clinical score of body weight change, stool, and fecal occult blood. (D) The spleens were harvested from the mice, and each group’s representative spleens were compared. (E) The colons were harvested from the mice and their length was measured. The graphs are represented as mean ± SEM (n=8). *,#P<0.05, **,##P<0.01. *DSS and nt-RORα-TMD 100 μg. #DSS and anti-IL-17A antibody.
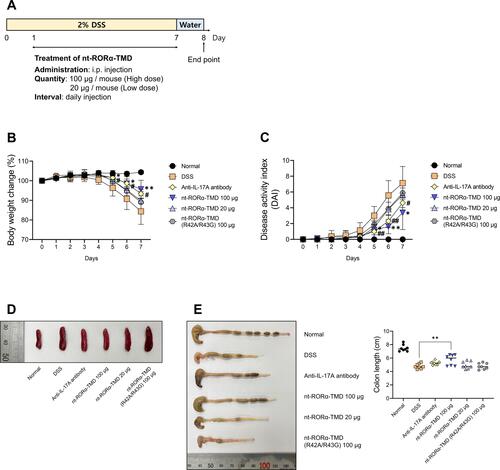
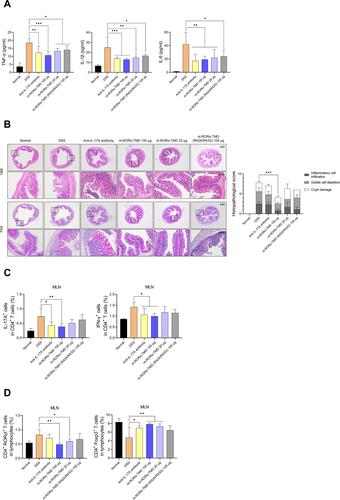
Figure 5 nt-RORα-TMD inhibits the secretion of pro-inflammatory cytokines and the level of pathogenic T cells in DSS-induced colitis. (A) The level of pro-inflammatory cytokines such as TNF-α, IL-1β, or IL-6 from the serum of the mice was measured by ELISA. (B) The sections of the colons were stained with H&E or PAS, and the histological images were obtained through an optical microscope. Histopathological scores of inflammatory cell infiltration, goblet cell depletion, and crypt damage were measured. (C and D) MLNs were isolated from the mice, and the cells from MLN were restimulated using the Cell Stimulation Cocktail for 4 hours. After restimulation, the population of IL-17A+ or IFN-γ+ cells among CD4+ T cells (C), and the population of CD4+RORγt+ or CD4+Foxp3+ T cells among whole lymphocytes (D) were analyzed by flow cytometry. The graphs are represented as mean ± SEM (n≥3). *P<0.05, **P<0.01, and ***P<0.001.