Figures & data
Figure 1 Three-dimensional segmentation of the CD and ITB. (A and D) CD and ITB venous ileocecal lesions. (B and E) Layer by layer delineation of lesions. (C and F) 3D ROI of ileocecal lesions.
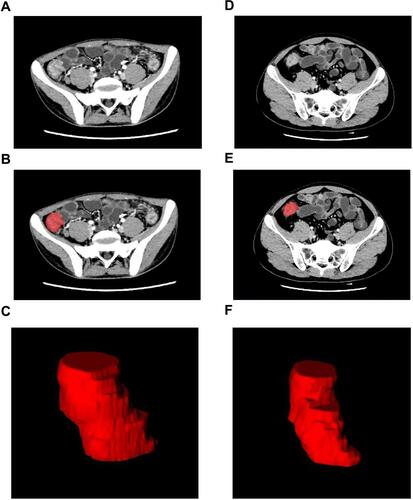
Table 1 Clinical Features of Patients with Crohn’s Disease and Intestinal Tuberculosis
Figure 2 The flow diagram of study.
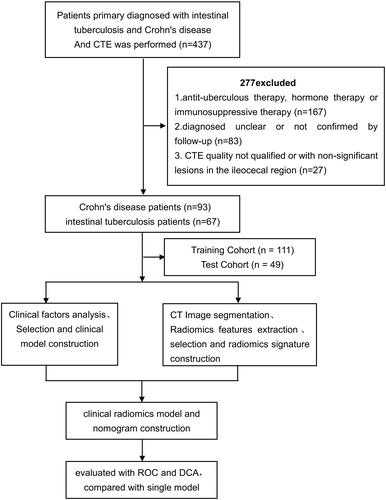
Table 2 Radiomic Features Selection from the CTE in the Training Cohort
Table 3 Performance of the Clinical Model, Radiomics Model, and Clinical Model in the Training Cohort and Test Cohort
Figure 3 The ROC curves of the three models. (A) Three models ROC curves in the training cohort. (B) Three models ROC curves in the validation cohort.
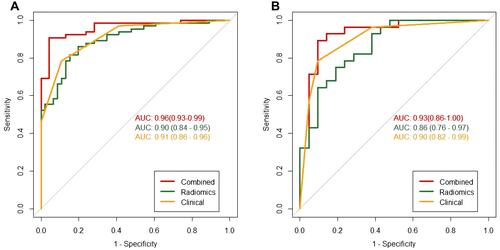
Figure 4 The decision curve analysis for three models. (A) Three models DCA in the training cohort. (B) Three models DCA curves in the validation cohort.
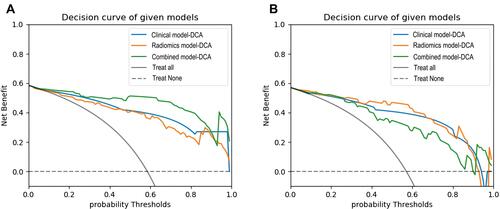
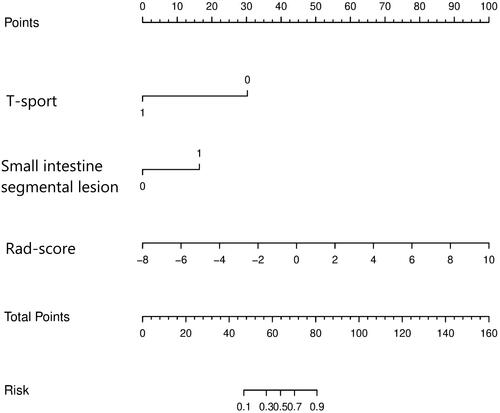
Figure 5 The clinical radiomics nomogram.