Figures & data
Figure 1 Animal experiment design.
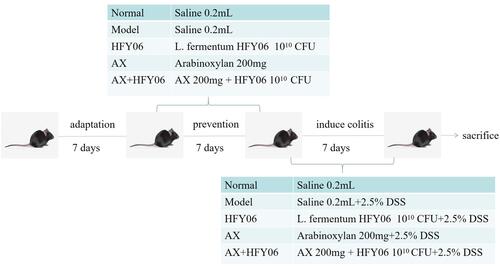
Table 1 Evaluation of the Disease Activity Index (DAI)
Table 2 Primer Sequence List
Table 3 Comparison of Anti-Inflammatory Effects Between Control Strain and L. fermentum HFY06 Strain
Figure 2 Effect of AX combine L. fermentum HFY06 supplementation on (A) body weight and (B) DAI of mice.
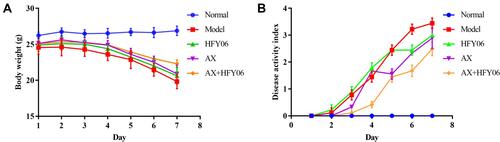
Table 4 Serum Levels of SOD, NO and MDA in Mice
Table 5 Serum Levels of IL-1β, IL-6, IL-12, TNF-α, IFN-γ, and IL-10 in Mice
Figure 3 Effect of AX combine L. fermentum HFY06 supplementation on myeloperoxidase (MPO) enzyme activity in colon tissue. HFY06: 2.5% DSS with L. fermentum HFY06 (1.0 × 10¹⁰ CFU), AX: 2.5%DSS with AX (200 mg/kg), AX+HFY06: 2.5% DSS with AX (200 mg/kg) and L. fermentum HFY06 (1.0 × 10¹⁰ CFU). Different letters above the histogram indicate significant differences (P<0.05).
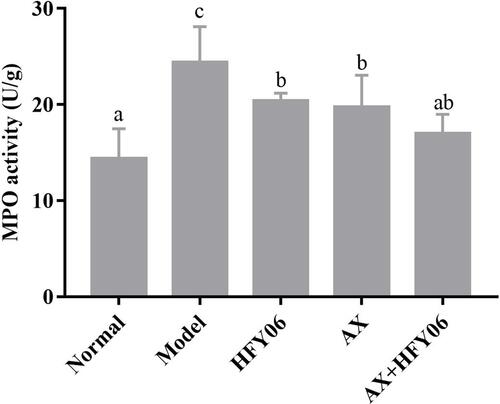
Figure 4 Effect of AX combine L. fermentum HFY06 supplementation on H&E pathological of colon tissue in mice ((A) Normal, (B) Model, (C) L. fermentum HFY06, (D) AX, (E) L. fermentum HFY06 combined with AX). HFY06: 2.5% DSS with L. fermentum HFY06 (1.0 × 10¹⁰ CFU), AX: 2.5%DSS with AX (200 mg/kg), AX+HFY06: 2.5% DSS with AX (200 mg/kg) and L. fermentum HFY06 (1.0 × 10¹⁰ CFU). Arrow 1 indicates inflammatory cell infiltration, arrow 2 indicates a reduction in goblet cells, and arrow 3 indicates colonic mucosal erosion.
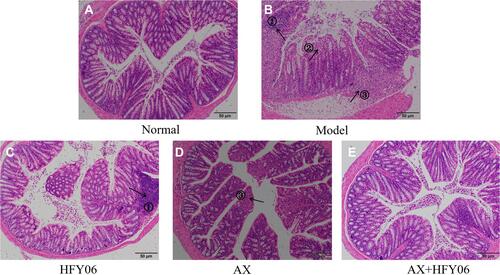
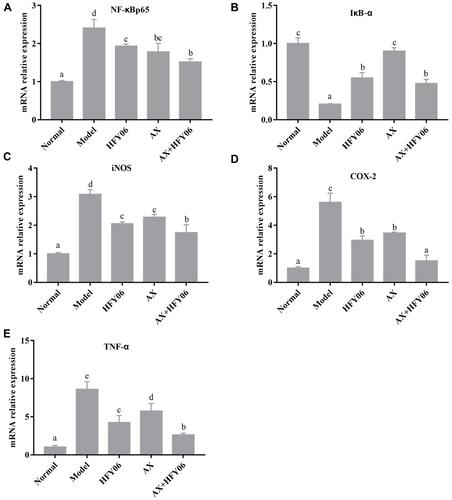
Figure 5 Effect of AX combine L. fermentum HFY06 supplementation on mRNA expression levels in colon tissues ((A) NF-κBp65, (B) IκB-α, (C) iNOS (D) COX-2, (E) TNF-α). HFY06: 2.5% DSS with L. fermentum HFY06 (1.0 × 10¹⁰ CFU), AX: 2.5%DSS with AX (200 mg/kg), AX+HFY06: 2.5% DSS with AX (200 mg/kg) and L. fermentum HFY06 (1.0 × 10¹⁰ CFU). Different letters above the histogram indicate significant differences (P<0.05).