Figures & data
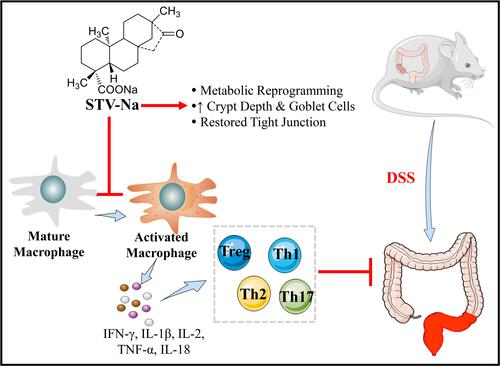
Figure 1 STV-Na protects mice against IBDs. Male Balb/c mice were intraperitoneally administered 10 mg/kg or 15 mg/kg STV-Na or normal saline twice daily for two consecutive days from days −2 to 7 and fed drinking water supplemented with 3.5% (w/v) DSS ad libitum from days 0 to 7. (A) Chemical structure of STV-Na. (B) Schematic diagram of the experiment. (C) Representative bloody stool samples from mice. (D) The body weight was measured daily. Data are charted in terms of percentages of basal body weight. (E) Colonic tissue samples. The distance between the red dotted line indicates the length of the colon. The colon length of the DSS model group is the shortest among different groups. (F) Length of the colon (cm) in the different groups was measured at the end of the experiment. (G) Spleen weight to body weight ratio. (H) Representative photographs of whole colon sections stained with H&E. Scale bars, 200 μm (50 µm in the magnified images). The arrows indicate inflammatory cell infiltration (red), crypt architectural abscess and distortion (yellow), and epithelial ulceration and erosion (black). (I) Histological scores of the H&E stained sections. Data are published in terms of means±SDs. The statistical analyses were performed with Student’s t-test or one-way ANOVA followed Turkey’s post hoc test (n = 6 to 12 mice per group; each data point represents one mouse); *P < 0.05 and **P < 0.01 in contrast to the DSS group.
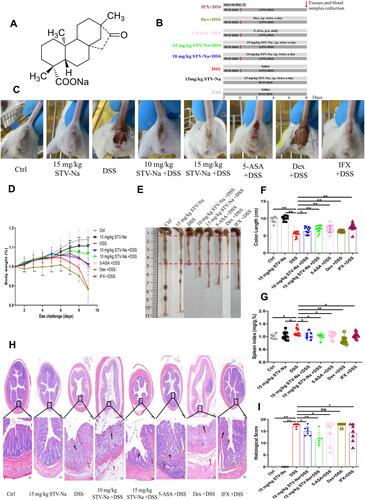
Figure 2 STV-Na ameliorates inflammation of DSS- triggered colitis in mice. (A–D) The following hematological parameters were determined from the whole blood of mice: the numbers of WBCs (A), NEUTs (B), LYMPHs (C), MONOs (D), RBCs (E), HGB (F), and HCT (G). (H–L) Mice serum was evaluated for multiple inflammatory cytokines using the Cytokine 17-Plex Mouse ProcartaPlex™. Data are published in terms of means ± SDs. The statistical analyses were performed with Student’s t-test or one-way ANOVA followed Turkey’s post hoc test (n = 4 to 12 mice per group; each data point represents one mouse); *P < 0.05 and **P < 0.01 in contrast to the DSS group.
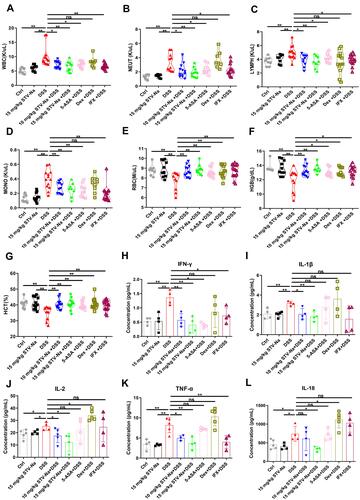
Figure 3 An untargeted metabolomics study revealed that STV-Na could regulate the metabolic profiles in mice with colitis. (A and B) PCA score plots of plasma samples obtained from different groups in the ESI positive-ion mode (A) and negative-ion mode (B). (C and D) PLS-DA scores scatter plot. The discriminant models distinguished different groups in the ESI positive-ion mode (C) and ESI negative-ion mode (D). (E and F) UpSet plot showing the overlap of metabolites identified across each group. The horizontal bars demonstrate total metabolites characterized in each group in both the ESI positive-ion mode (E) and ESI negative-ion mode (F). The vertical bars indicate intergroup intersections, as depicted in the matrix below the graph. (G and H) Volcano plot. A total of 144 and 138 variables were selected based on the fold change (>2) and P (<0.05) values in the ESI positive-ion mode (G) and ESI negative-ion mode (H) (n = 6 to 12 mice per group).
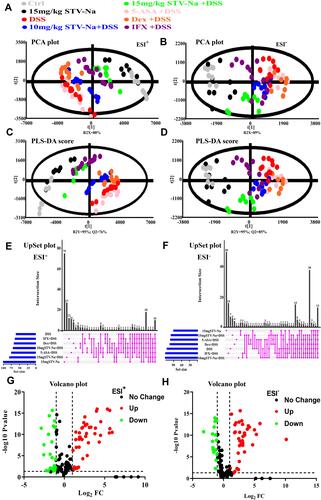
Figure 4 (A) Heatmap of differentially accumulated metabolites. Each metabolite is represented by a row and each sample is represented by a. The red color represents high abundance, and blue indicates low abundance (n = 7 to 9 mice per group). (B) Metabolic pathway analysis of effects of STV-Na on colitis. Circle colors represent p values (y-axis) while circle sizes indicate the pathway impact (x-axis). The involved pathways of the circles are shown, with the red circles indicating pathways with significant changes.
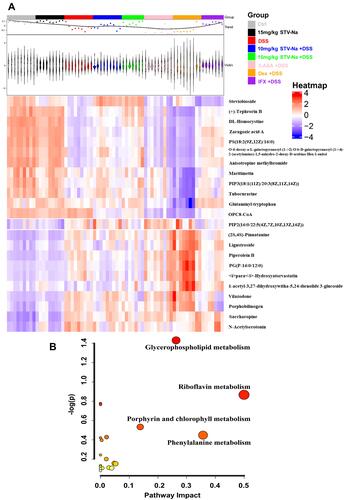
Figure 5 STV-Na regulates the balance of M1/M2 macrophage polarization in mice with IBD. (A) Schematic of experiments analyzing macrophage polarization in DSS-triggered colitis. (B and C) TNF-α and IL-1β gene expression in colon tissues were examined by RT-qPCR. (D) Immunofluorescence staining (scale bars: 100 µm) of F4/80+ and F4/80+CD86+ macrophages in colonic tissues from mice with DSS-induced colitis. (E and F) Quantification of M1 (CD86+F4/80+) (E) and M0 (F4/80+) (F) macrophages per field. Data are published in terms of means ± SDs. The statistical analyses were performed with Student’s t-test or one-way ANOVA followed Turkey’s post hoc test (n = 3 to 6 mice per group; each data point represents one mouse); *P < 0.05 and **P < 0.01 in contrast to the DSS group.
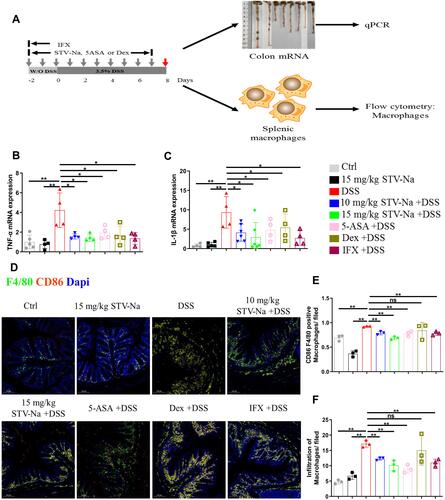
Figure 6 STV-Na restores the balance of M1/M2 macrophage polarization in the spleens of mice with IBDs. (A and B) The percentages and absolute numbers of M1 macrophages (F4/80+CD11c+CD206-) (A) and M2 macrophages (F4/80+CD11c-CD206+) (B) in the spleen were analyzed by flow cytometry. Data are published in terms of means ± SDs. The statistical analyses were performed with Student’s t-test or one-way ANOVA followed Turkey’s post hoc test (n = 6 to 12 mice per group; each data point represents one mouse); *P < 0.05 and **P < 0.01 in contrast to the DSS group.
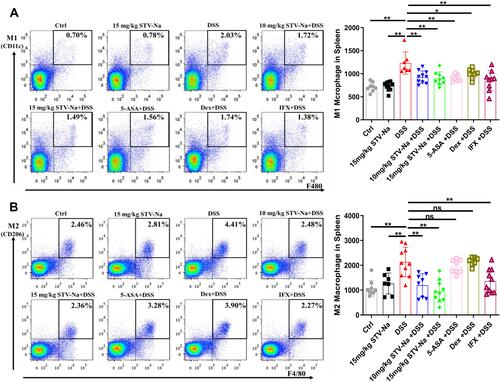
Figure 7 STV-Na restores the balance of Th1 cells, Th2 cells, Th17 cells, and Tregs by enhancing the production of Tregs in mice with IBDs. Mice with DSS-triggered acute colitis were administered either saline, STV-Na, 5-ASA, Dex, or IFX. (A) IFN-γ, IL-4, and IL-17A gene expression in colon tissues was examined by real-time qPCR. (B–E) The percentages and absolute numbers of Th1 (CD4+IFN-γ+) (B), Th2 (CD4+IL-10+) (C), Th17 (CD4+IL-17A+) (D), and Treg (CD25+Foxp3+) (E) cells in the spleen were analyzed by flow cytometry. Data are published in terms of means ± SDs. The statistical analyses were performed with Student’s t-test or one-way ANOVA followed Turkey’s post hoc test (n = 4 to 12 mice per group; each data point represents one mouse); *P < 0.05 and **P < 0.01 in contrast to the DSS group.
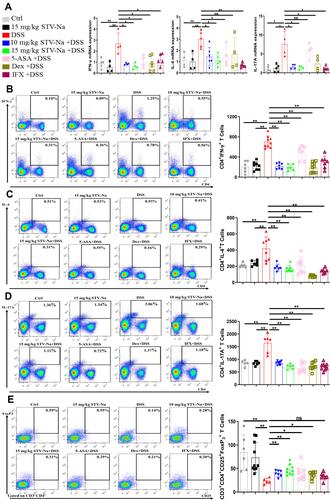
Figure 8 STV-Na improves intestinal permeability in mice with IBDs. (A) Intestinal permeability was analyzed via the intragastric administration of 4.0-kDa FITC-dextran. (B) DAO activity in plasma. (C) Endotoxin (LPS) levels in plasma. (D) Typical histological images of AB/PAS-stained colonic tissue from different groups. Scale bars, 200 μm (50 µm in the magnified images). (E) Number of goblet cells. (F) The crypt depth in each group was assessed. Data are published in terms of means ± SDs. The statistical analyses were performed with Student’s t-test or one-way ANOVA followed Turkey’s post hoc test (n = 3 to 8 mice per group; each data point represents one mouse); *P < 0.05 and **P < 0.01 in contrast to the DSS group.
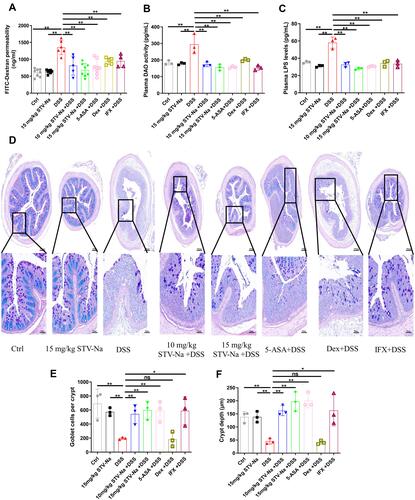
Figure 9 STV-Na ameliorates DSS-induced damage to the intestinal barrier through the restoration of tight junction function. (A–E) The mRNA levels of colonic Reg3γ (A), MUC2 (B), ZO-1 (C), Claudin-1 (D), and Occludin (E) were examined by RT-qPCR. (F) The distribution of MUC2, ZO-1, and Claudin-1 in colonic tissues was evaluated by immunohistochemical staining. (G–I) Quantification of the immunohistochemical intensity reflecting the expression of MUC2 (G), ZO-1 (H), and claudin-1 (I) in the mice colon. Data are published in terms of means ± SDs. The statistical analyses were performed with Student’s t-test or one-way ANOVA followed Turkey’s post hoc test (n = 4 to 10 mice per group; each data point represents one mouse); *P < 0.05 and **P < 0.01 in contrast to the DSS group.
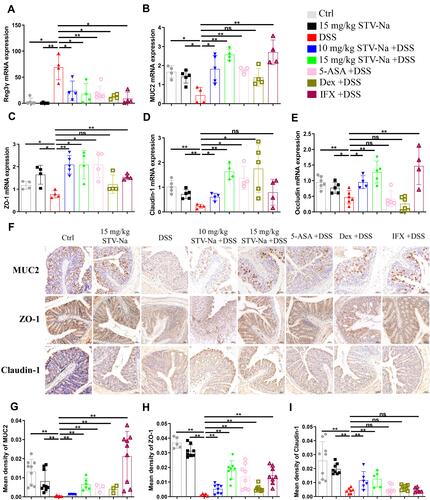
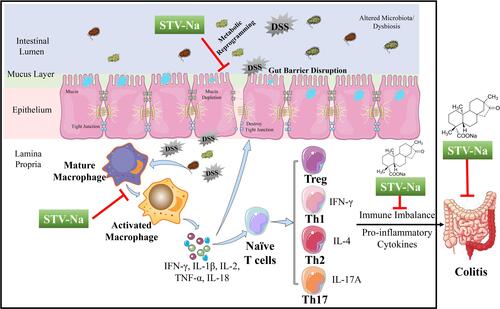
Figure 10 Proposed mechanism through which STV-Na suppresses DSS- triggered IBD in mice. In the pathogenesis of colitis, a dysregulated immune response (macrophage polarization and Th1/Th2/Th17/Tre cells imbalance) accounts for the abnormal metabolism. Cytokine expression levels were significantly altered in DSS-induced mice compared with healthy controls, and this alteration led towards disrupted intestinal barrier integrity in mice. The treatment of DSS-induced mice with STV-Na resulted in marked improvements in dysregulated metabolic profiles, primarily glycerophospholipid, riboflavin, porphyrin and chlorophyll, and phenylalanine metabolism. STV-Na further improved the immune response and intestinal barrier dysregulation by reconstituting the gut barrier integrity in mice with DSS-induced IBDs.