Figures & data
Table 1 Baseline Characteristics of EC Patients
Figure 1 Characteristics of inflammatory immune cells in EC with LNM and no LNM.
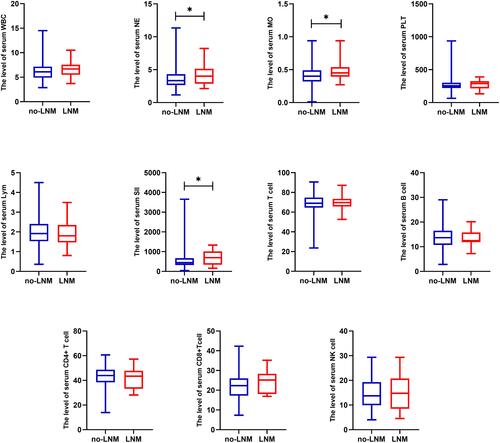
Figure 2 The ROC curve. The ROC curve for NE, MO, SII, CA125, CA199, CA153, and Ki67. The cutoff values for these indicators were identified. P<0.05 indicates significant differences.
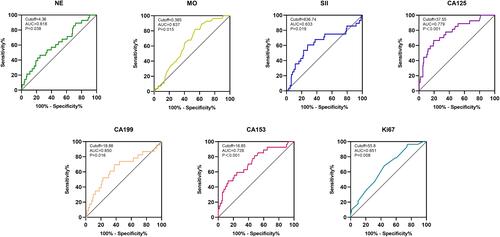
Figure 3 The logistic regression analyses. (A) Univariate logistic regression analyses for LNM. (B) Multivariate logistic regression analyses for LNM. P<0.05 indicates significant differences.
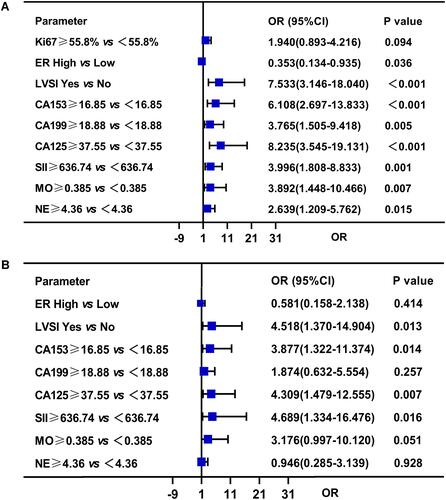
Figure 4 (A) The nomogram for predicting LNM with SII, CA125, CA153, and LVSI. (B) The calibration plots for the nomogram. (C) The ROC curve for the nomogram.
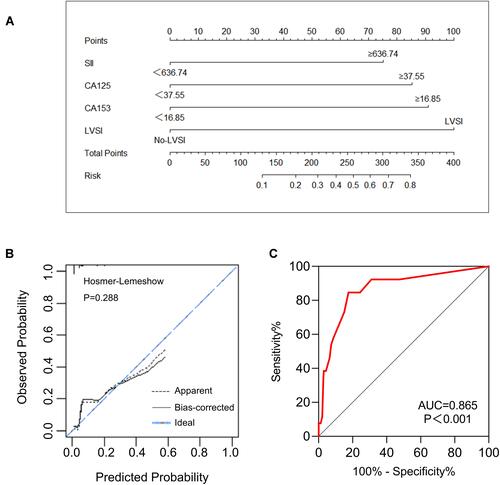
Table 2 Associations of SII with Clinicopathological Characteristics
Table 3 Correlations Between Clinical or Biochemical Parameters and SII in EC Patients
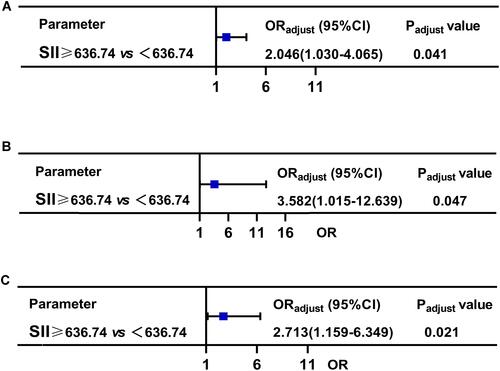
Figure 5 The logistic regression analyses. (A) Multivariate logistic regression analyses for myometrial invasion in premenopausal young EC. (B) Multivariate logistic regression analyses for histologic grade in premenopausal young EC. (C) Multivariate logistic regression analyses for FIGO stage in postmenopausal or age≥55 EC.