Figures & data
Table 1 Death of Mice in Each Group (n)
Table 2 Weight of Mice in Each Group (g)
Figure 1 Effect of sodium cyclamate on mice weight. The weight changes were recorded from before adaption to sodium cyclamate-treated at 168h. Values are the mean±standard deviation. **P < 0.01 vs parallel control group.
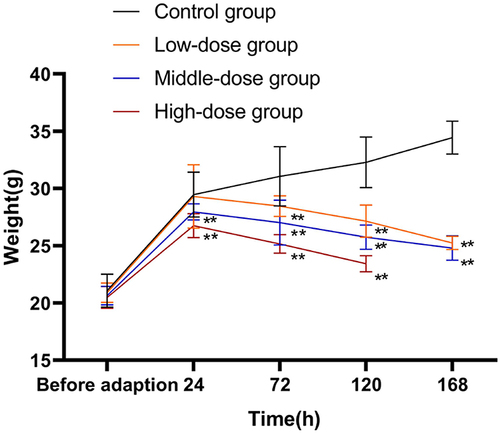
Table 3 ALT Level in Each Group (u/l)
Table 4 AST Level in Each Group (u/l)
Table 5 TBIL Level in Each Group (μmol/l)
Table 6 DBIL Level in Each Group (μmol/l)
Figure 2 Effect of sodium cyclamate on serum levels of liver enzymes and bilirubin of mice. The serum levels of ALT (A), AST (B), TBIL (C) and DBIL (D) were measured sodium cyclamate-treated at 24h, 72h, 120h and 168h. Values are the mean±standard deviation. *P < 0.05 vs parallel control group; **P < 0.01 vs parallel control group; #p < 0.01 vs 24h in this group. ALT, alanine aminotransferase; AST, aspartate aminotransferase; TBIL, total bilirubin; DBIL, direct bilirubin.
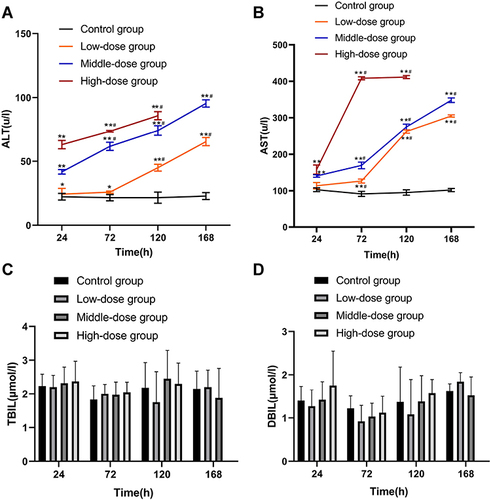
Table 7 CK Level in Each Group (u/l)
Table 8 CK-MB Level in Each Group (u/l)
Table 9 cTnT Level in Each Group (μg/l)
Figure 3 Effect of sodium cyclamate on serum levels of heart enzymes and cardiac troponin of mice. The serum levels of CK (A), CK-MB (B) and cTnT (C) were measured sodium cyclamate-treated at 24h, 72h, 120h and 168h. Values are the mean±standard deviation. *P < 0.05 vs parallel control group; **P < 0.01 vs parallel control group; #p < 0.01 vs 24h in this group. CK, creatine kinase; CK-MB, creatine kinase-MB; cTnT, cardiac troponin T.
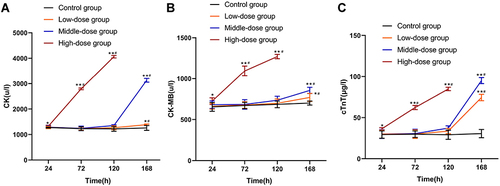
Table 10 SCr Level in Each Group (μmol/l)
Table 11 BUN Level in Each Group (Mmol/l)
Figure 4 Effect of sodium cyclamate on serum levels of creatinine and blood urea nitrogen of mice. The serum levels of SCr (A) and BUN (B) were measured sodium cyclamate-treated at 24h, 72h, 120h and 168h. Values are the mean±standard deviation. SCr, serum creatinine; BUN, blood urea nitrogen.
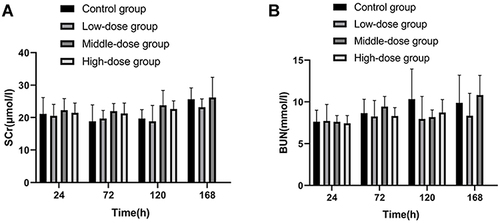
Figure 5 Sodium cyclamate induced liver injury. The liver sections were stained with HE and examined (magnification ×400). HE, hematoxylin and eosin.
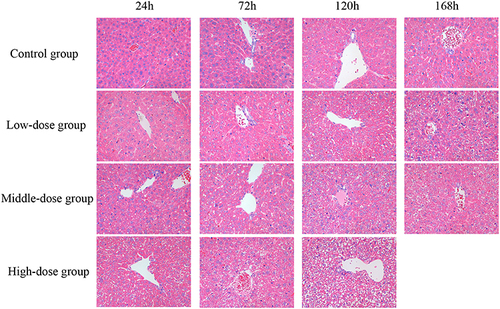
Figure 6 Sodium cyclamate induced heart injury. The heart sections were stained with HE and examined (magnification ×400). HE, hematoxylin and eosin.
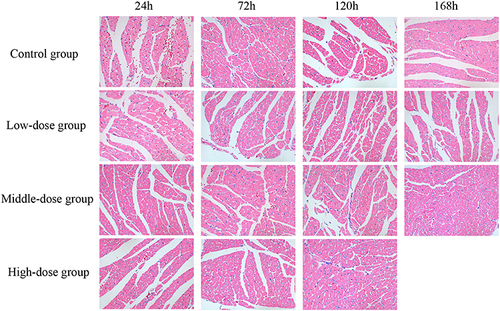
Figure 7 Sodium cyclamate induced kidney injury. The kidney sections were stained with HE and examined (magnification ×400). HE, hematoxylin and eosin.
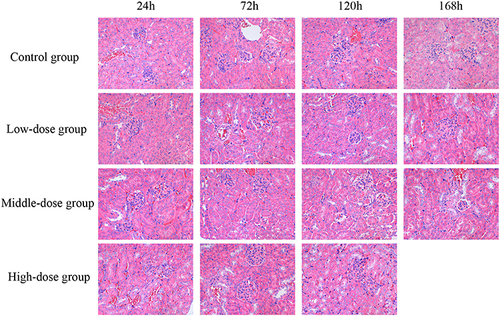
Figure 8 Sodium cyclamate induced liver injury by intraperitoneal injection of 6000 mg/kg/day for 5 days successfully. It was evidenced by transmission electron microscopy micrographs of the hepatocytes of the liver tissue in the control (A and B) and sodium cyclamate-treated at 120h (C and D) groups. (scale bars: (A) 10 μm; B, (C) 2 μm; (D) 1μm).
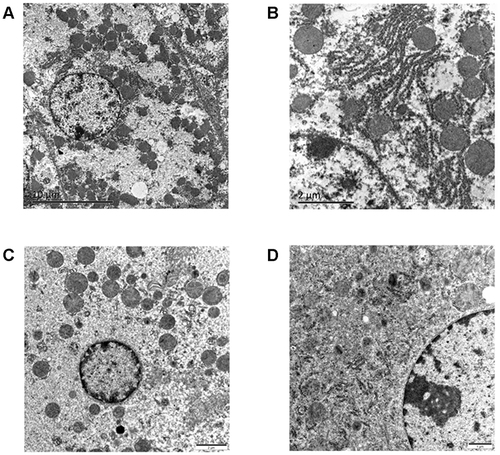
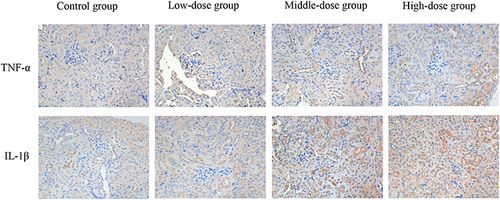
Table 12 The Expression of TNF-α and IL-1β Protein in the Liver at 120h (IOD/Area)
Figure 9 The IOD/Area value of TNF-α and IL-1β positive expression in the liver (A), heart (B) and kidney (C) tissues positive expression in each group. The IOD/Area were measured at 120h. Values are the mean±standard deviation. *P < 0.05 vs control group; **P < 0.01 vs control group. IOD/Area, average optical density.
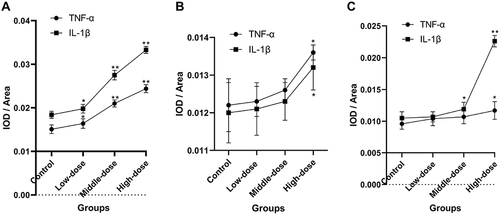
Figure 10 Expression of TNF-α and IL-1β detected via immunohistochemistry in the liver sections at 120h (magnification ×400). The positive color was tan.
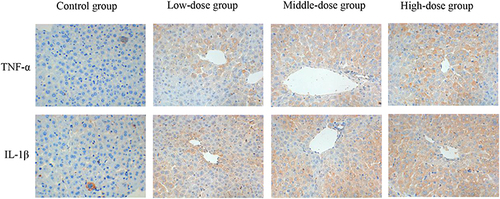
Table 13 The Expression of TNF-α and IL-1β Protein in the Heart at 120h (IOD/Area)
Figure 11 Expression of TNF-α and IL-1β detected via immunohistochemistry in the heart sections at 120h (magnification ×400). The positive color was tan.
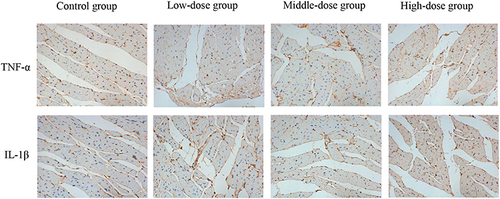
Table 14 The Expression of TNF-α and IL-1β Protein in the Kidney at 120h (IOD/Area)
Figure 12 Expression of TNF-α and IL-1β detected via immunohistochemistry in the kidney sections at 120h (magnification ×400). The positive color was tan.