
Figures & data
Table 1 Characteristics of the Patients Included in the Study and of Treatment Modality (Significance Was Assessed with Chi-Squared Test, Where Not Specified or the Two-Tailed t-Test or the Mann Whitney Test)
Table 2 Values at Day 0 Followed Over Time in aSAH Amd Sm Patients, Respectively. Mean Values and SD are Presented and results of Univariate Analysis (Two-Tailed tTest)
Figure 1 Erythrocytes, platelets, and inflammatory markers over time after spontaneous SAH. (A) Hematocrit; (B) Hemoglobin (C) Erythrocytes; (D) Platelets; (E) Prothrombin activity; (F) Antithrombin III; (G) Fibrinogen; (H) C-reactive protein; (I) Temperature. Graphs showing mean values of patients, 48 patients at the 6 time points defined as days after SAH. The vertical bars show mean and standard error. Patients with aneurysm-related SAH (aSAH) n=42, in white circles and patients with sine materia SAH, also called SAH of unknown origin (Sm SAH) n=6, in black circles. The stars indicate statistical significance at the unpaired two-tailed t-test made at each time point. Small dotted horizontal lines indicate in the graph the normal range reference values where available and/or useful.
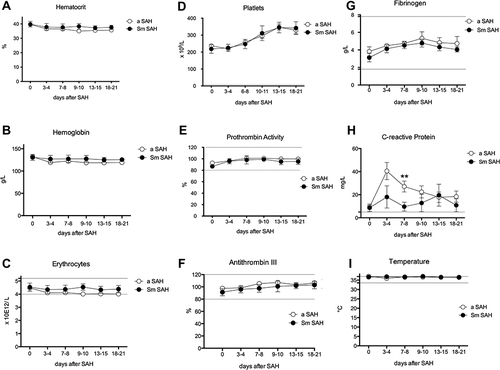
Figure 2 Circulating Leukocyte subpopulations over time after spontaneous SAH. (A) Leukocytes; (B) Neutrophils; (C) % of Neutrophils (D) Lymphocytes; (E) % of Lymphocytes; (F) Eosinophils; (G) % of Eosinophils; (H) Basophils; (I) % of Basophils; (J) Monocytes; (K) % of Monocytes. Graphs showing mean values of patients, 48 patients at the 6 time points defined as days after SAH. The vertical bars show mean and standard error. Patients with aneurysm-related SAH (aSAH) n=42, in white circles and patients with sine materia SAH, also called SAH of unknown origin (Sm SAH) n=6, in black circles. The stars indicate statistical significance at the unpaired two-tailed t-test made at each time point, * with p-value <0.05, ** with p-value <0.01, and *** with p-value <0.001. Small dotted horizontal lines indicate in the graph the normal range reference values where available and/or useful.
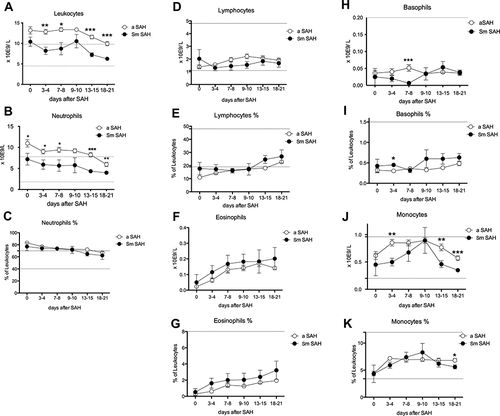
Figure 3 Blood lymphocyte subsets and monocyte counts after spontaneous SAH. (A) CD4 positive Lymphocytes; (B) % of CD4 positive Lymphocytes; (C) CD8 positive Lymphocytes; (D) % of CD8 positive Lymphocytes; (E) B Lymphocytes; (F) % of B Lymphocytes; (G) Natural Killer (NK) Lymphocytes; (H) % of Natural Killer (NK) Lymphocytes; (I) CD CD14++ CD16- of DR+ Monocytes; (J) % of CD14++ CD16- Monocytes. (K) 14+ CD16+ of DR+ Monocytes; (L) % of CD14+ CD16+ of DR+ Monocytes. Graphs showing mean values of patients, 48 patients at the 6 time points defined as days after SAH. The vertical bars show mean and standard error. Patients with aneurysm-related SAH (aSAH) n=42, in white circles and patients with sine materia SAH, also called SAH of unknown origin (Sm SAH) n=6, in black circles. The stars indicate statistical significance at the unpaired two-tailed t-test made at each time point, * with p-value <0.05 and ** with p-value <0.01. Small dotted horizontal lines indicate in the graph the normal range reference values where available and/or useful.
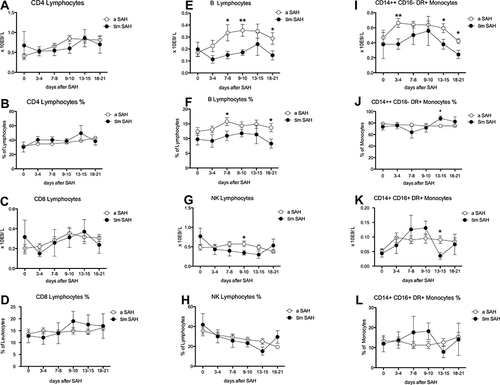
Figure 4 Inflammatory indices over time after spontaneous SAH and ROC curves analysis at day 0. (A) Lymphocytes-to-Monocyte Ratio; (B) Platelet-to-Lymphocyte Ratio; (C) Neutrophil-to-Lymphocyte Ratio; (D) Systemic Inflammation Response Index; (E) Systemic Immune-Inflammation Index; (F) Neutrophil-to-Lymphocyte Ratio; (G) Lymphocyte-to-Monocyte Ratio; (H) Systemic Inflammation Response Index. Graphs (A-E) showing mean values of patients, 48 patients at the 6 time points defined as days after SAH. The vertical bars show mean and standard error. Patients with aneurysm-related SAH (aSAH) n=42, in white circles and patients with sine materia SAH, also called SAH of unknown origin (Sm SAH) n=6, in black circles. The stars indicate statistical significance at the unpaired two-tailed t-test made at each time point, * with p-value <0.05, ** with p-value <0.01, and *** with p-value <0.001. Small dotted horizontal lines indicate in the graph the normal range reference values where available and/or useful.
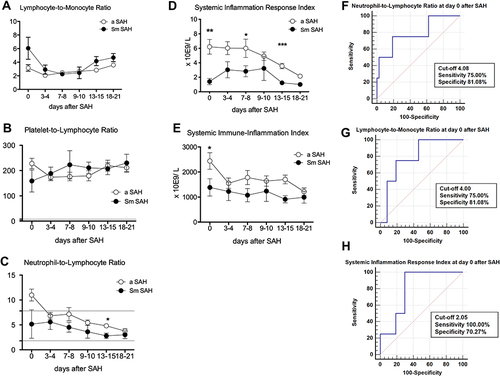
Table 3 Multivariable Logistic Regression (Best Model Shown)