Figures & data
Figure 1 Effect of ICT on ENU-induced leukemia in (A) Body weight; (B) Spleen and liver index; (C) Photographs of the spleen; (D) Images of peripheral blood smears of the experimental group. The red arrow indicates leukemic blast cells. Data are mean ± SD (n = 6). Scale bar= 50 µm, Magnification= 400 ×, *P < 0.01 vs normal control, #P < 0.01 vs Leukemic group.
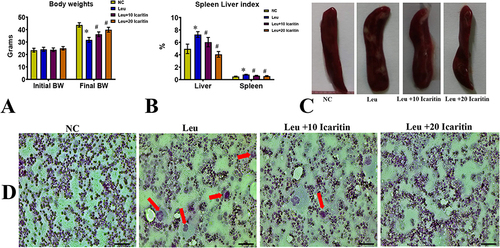
Figure 2 Effect of ICT on haematological parameters in ENU-induced leukemic mice (A) RBC; (B) WBC; (C) Hb; (D) Platelet count. “Data are mean ± SD (n = 6). *P < 0.01 vs normal control, #P < 0.01 vs Leukemic group.
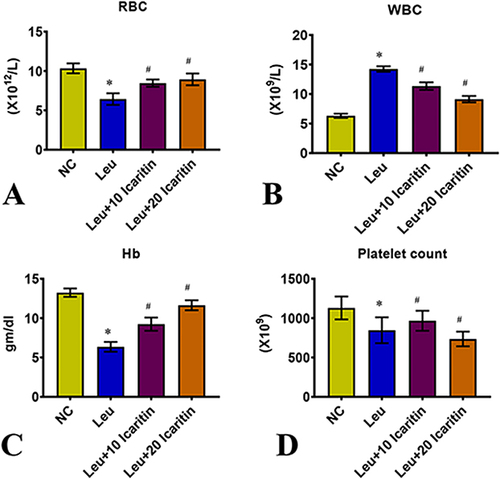
Figure 3 Effect of ICT on histopathological changes in ENU-induced leukemic mice. Representative H&E-stained (A) Spleen and (B) liver tissue section images. Scale bar= 50 µm, Magnification= 400 ×.
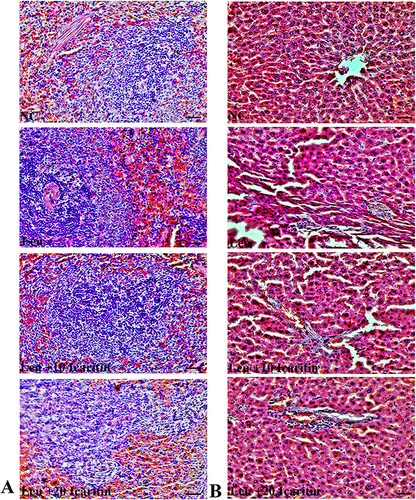
Figure 4 Effect of ICT on inflammatory markers in ENU-induced leukemic mice (A) NF-κB p65; (B) TNF-α; (C) IL-1β; (D) IFN-γ in spleen and liver. Data are mean ± SD (n = 6). *P < 0.01 vs normal control, #P < 0.01 vs Leukemic group.
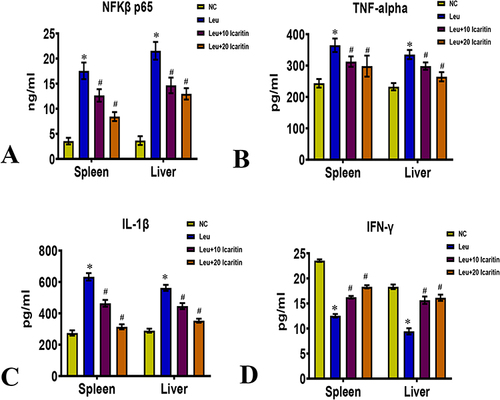
Figure 5 Immunohistochemistry results show protein distribution of NF-κB p65 in the (A) spleen and (B) liver of ENU-induced leukemic mice. Scale bar= 50 µm, Magnification= 400 ×.
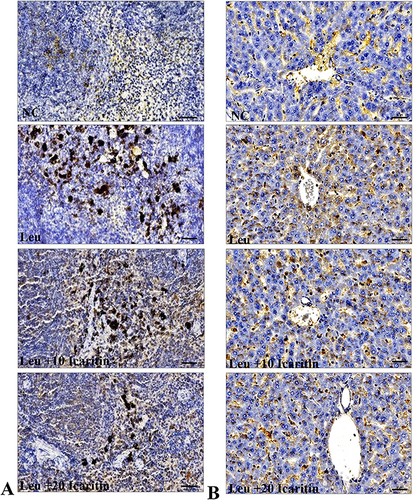
Figure 6 Effect of ICT on IL-6/JAK2/STAT3 in ENU-induced leukemic mice (A) IL-6; (B) JAK-2; (C) STAT 3 in spleen and liver. Data are mean ± SD (n = 6). *P < 0.01 vs normal control, #P < 0.01 vs Leukemic group.
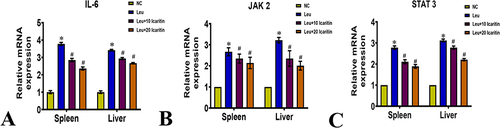
Figure 7 Immunofluorescence analysis of proteins in the JAK-STAT pathway in spleen sections from ENU-leukemia mice of (A) JAK2 (green) and p-JAK2 (red) staining, showing higher levels of JAK2 phosphorylation in ENU-leukemia mice compared to control mice., (B) STAT3 (green) and p-STAT3 (red) staining, indicating enhanced STAT3 signaling in ENU-leukemia mice compared to control mice. Scale bar= 50 µm, Magnification= 400 ×.
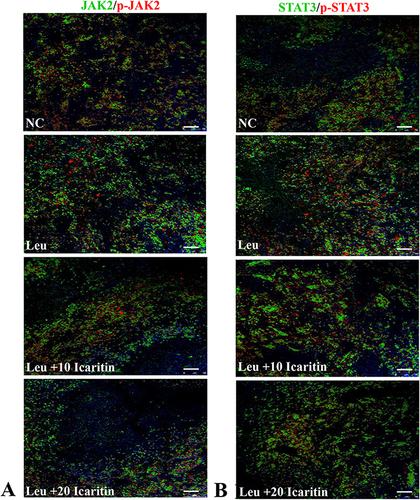
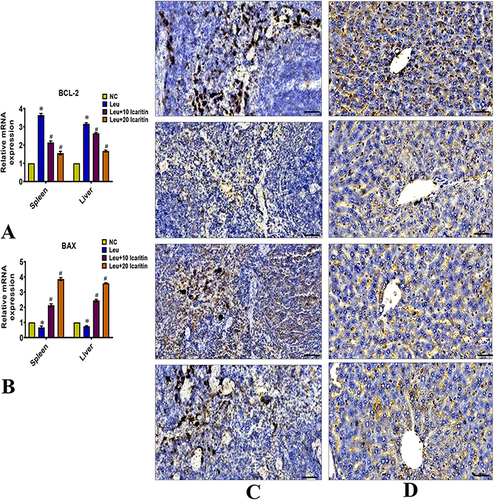
Figure 8 Effect of ICT on apoptosis markers in ENU-induced leukemic mice (A) BCL-2; (B) BAX in spleen and liver. Immunohistochemistry results show protein distribution of Bax in (C) spleen and (D) liver. Data are mean ± SD (n = 6). *P < 0.01 vs normal control, #P < 0.01 vs Leukemic group. Scale bar= 50 µm, Magnification= 400 ×.