Figures & data
Figure 1 Workflow chart of this study.
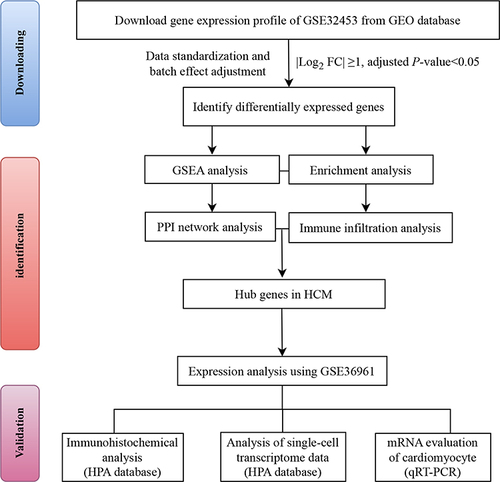
Figure 2 Screening and biological function analysis of differentially expressed genes between HCM and healthy controls. (A) Volcano plots of differentially expressed genes between control and HCM groups, red nodes indicate upregulation, blue nodes indicate downregulation and gray nodes indicate no significant differences. (B) The heatmap of differentially expressed genes between the control and HCM groups. (C) Analysis of differential gene GO enrichment in HCM. (D) Enrichment analysis of the differential gene KEGG signaling pathway in HCM.
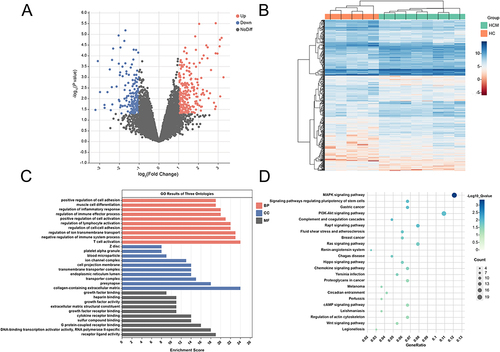
Figure 3 Results of GESA in HCM of GSE32453 database. (A) KEGG enrichment analyses using GSEA. (B) Results for GESA-KEGG ridgeline plots. (C) GO enrichment analyses using GESA. (D) Results for GESA-GO ridgeline plots.
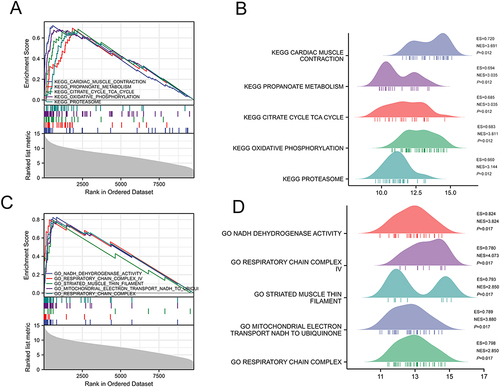
Figure 4 Immune infiltration analysis between HCM patients and healthy controls. (A) Clustering of twenty-two immune cells in HCM and healthy control samples. (B) The percentage of twenty-two subpopulations of immune cells for each sample in HCM and healthy controls. (C) Correlation analysis between twenty-two immune cells in HCM. (D) The difference of immune cells between HCM patients and healthy controls.
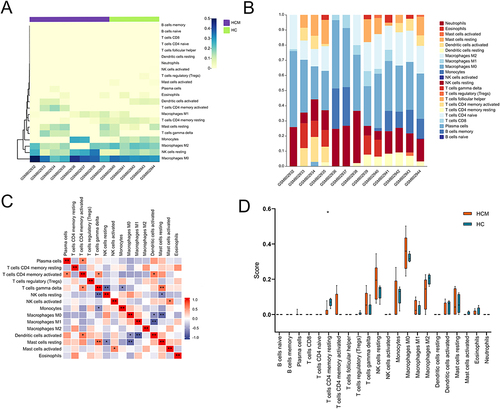
Table 1 Core Target Gene Information
Figure 5 PPI network of DEGs extracted by MCODE. (A) The interaction network between proteins coded by DEGs was comprised of 416 nodes and 890 edges. The larger and darker the circle, the more important the gene. (B) Interaction of top 10 genes calculated by MCODE.
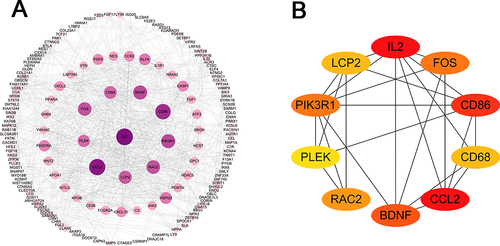
Figure 6 Predictive value of hub genes for HCM. (A) Hub genes expression in the GSE36961 dataset between the HCM and control group. (B) The ROC curves were shown in the validation set for eight key genes with AUCs > 0.8 in the GSE36961 dataset. Error bars indicate mean ± standard deviation. **P<0.01; ****P<0.0001.
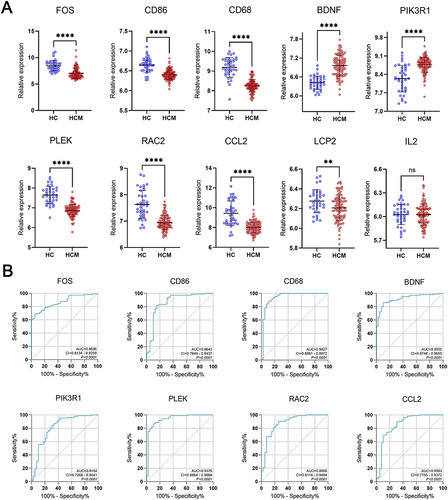
Figure 7 Subcellular localization of eight key genes. (A) The expression of the eight major genes for humans with normal cardiac tissue in the HPA database is determined by immunohistochemistry. (B) Transcriptome study of Single-cell for the eight major genes found in the HPA database.
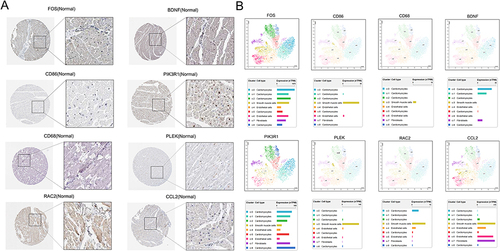
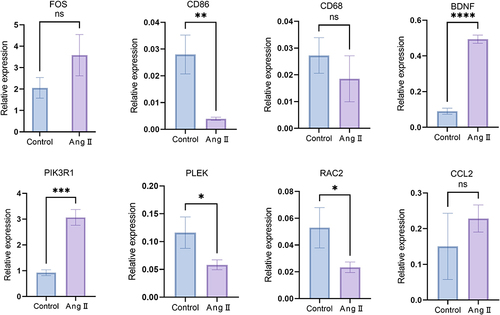
Figure 8 The mRNA levels of eight key genes in the H9c2 cells from cardiomegaly group and control group. Error bars indicate mean ± standard deviation. *P<0.05, **P<0.01; ***P<0.001, ****P<0.0001.