Figures & data
Figure 1 Films of immunoblots for nuclear p65 in ThP-1 cells (left) and RaW 264.7 cells (right) dosed with lPs after 1 hour.
Notes: Films are displayed with corresponding lPs dose below in ng/ml. On top are p65 1-minute films (A) along with 10-second actin films on the bottom (B). This figure is representative of three experiments (n=3).
Abbreviation: lPs, lipopolysaccharide.
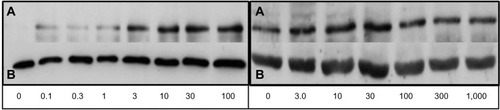
Figure 2 Results of densitometry on developed films of immunoblots of nuclear extract from ThP-1 cells (black) and RaW 264.7 (white) dosed with varying increasing concentrations of lPs (n=3).
Notes: Bar charts are displayed with P65:actin ratio mean on the Y-axis and lPs dose (ng/ml) on the X-axis. Means are plotted with standard error of the means. Experiments were repeated three times (n=3).
Abbreviation: lPs, lipopolysaccharide.
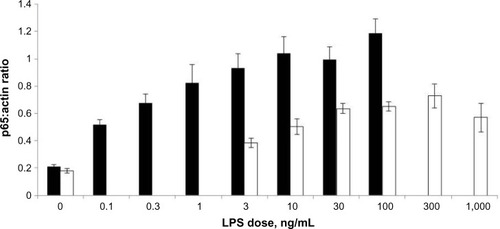
Figure 3 Results of dose response analysis for LPS dose vs p65:actin ratio in THP-1 and RAW 264.7 cell lines.
Notes: Dose–response curves for (A) THP-1 and (B) RAW 264.7 cell lines dosed with varying concentrations of LPS. The X-axis is the log values of the concentrations with fold increase in the p65:actin ratio on the Y-axis. Fold increase was calculated by dividing the mean basal p65 response into all other mean doses. Means are plotted with SEM. Experiments were repeated three times (n=3).
Abbreviations: IPS, lipopolysaccharide; SEM, standard error of the mean.
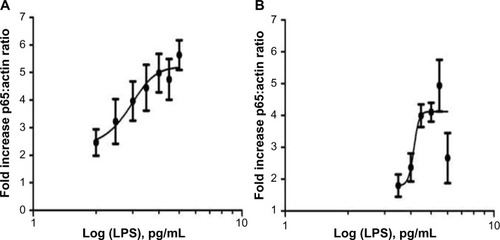
Figure 4 Representative slides from liver for animals receiving IP saline/lPs/stool suspension.
Notes: Hematoxylin and eosin staining of C57BL/6 mouse liver at 6 hours post (A) intraperitoneal (IP) injection with saline. Normal histology noted, DG (B) IP inoculation of stool (5 µl/g body weight). Liver parenchyma with capsule, exhibiting focal serosal attachment of nls and cellular debris (perihepatitis). Underlying the infiltrate is a thin layer of subserosal neutrophils. Ba from the stool suspension can also be seen. (C and D) IP injection with LPS (25 mg/kg). Liver parenchyma with neutrophils in the lumen of CVs and PVs. Closer view of the liver parenchyma highlights the increased amount of neutrophils between hepatic cords. Hepatocytes do not exhibit cytoplasmic vacuolation, consistent with a diffuse loss of glycogen (scale bar =20 µm, A–C; scale bar =10 µm, D). Representative examples of neutrophils are circled “NL” in B and C and arrowed “NL” rolling along the hepatic chords in D. Bacterial colonies are circled “Ba” in B.
Abbreviations: Db, bacterial debris; Gly, glycogen; LPS, lipopolysaccharide; NLs, neurtrophils; CVs, central veins; PVs, portal veins; Ba, bacterial colonies; DG, diffuse glycogen.
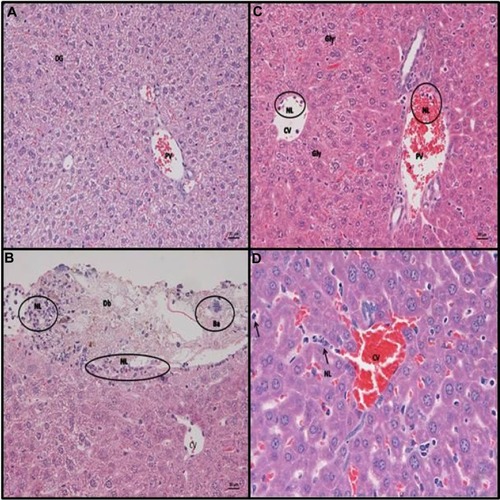
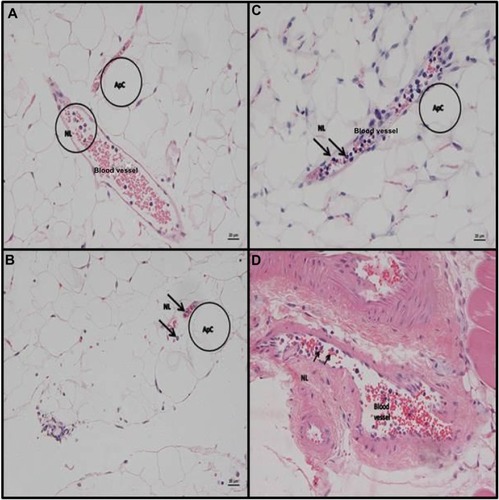
Figure 5 Representative slides from adipose tissue and muscle for animals receiving IP stool suspension.
Notes: Hematoxylin and eosin staining (H&E) of c57Bl/6 mouse adipose tissue and muscle at 6 hours post- IP inoculation of stool (5 µl/g body weight). (A) epididymal adipose tissue. Embedded between ApCs are veins that exhibit several neutrophils in the lumen. (B) Peri-renal fat with focal serosal neutrophil infiltration with mixed bacteria (peritonitis) and veins containing neutrophils in the lumen. (C) Epididymal adipose tissue. Vein packed with NLs. H&E stain. (D) Muscle gastrocnemius. Larger artery with several neutrophils in the lumen (scale bar =20 µm, A–D). Representative adipocytes ApC are circled “Apc” in A, B, and C. A circle labeled “NL” marks a representative group of neutrophils in A and individual rolling neutrophils are arrowed “NL” in D.
Abbreviations: IP, intraperitoneal; LPS, lipopolysaccharide; ApCs, adipocytes; NLs, neutrophils.