509
Views
2
CrossRef citations to date
0
Altmetric
Original Research

A Deep Learning Model to Predict Knee Osteoarthritis Based on Nonimage Longitudinal Medical Record

ORCID Icon, ORCID Icon, ORCID Icon, ORCID Icon, ORCID Icon, , ORCID Icon, ORCID Icon, ORCID Icon & ORCID Icon show all
Pages 2477-2485 | Published online: 11 Sep 2021

Figures & data

Figure 1 Electronic Medical Record (EMR) matrix and network architecture of Deep-KOA. The vertical axis of the input matrix consists of diagnostic and medication codes. The diagnostic features occupy 1029 blocks out of all 1098 International Classification of Diseases, Ninth Revision, Clinical Modification (ICD-9-CM) codes, and the medication features occupy 695 blocks out of all 830 World Health Organization-Anatomical Therapeutic Chemical (WHO-ATC) codes. The horizontal axis consists of 157 weeks (three years), and each cell is filled with visiting history of the patient. For each diagnosis code per week, the value is divided by seven (one week consist of seven days), and for each medication per week, the value is divided by 28 (assuming: one medication maximum prescribed as 4×7 days in a week). The EMR matrix data are fed to the convolutional neural network (CNN) architecture with leaky rectified linear unit (ReLU), and the static data (maximum age and sex of the patient) are fed to the artificial neural network (ANN) architecture.

Figure 1 Electronic Medical Record (EMR) matrix and network architecture of Deep-KOA. The vertical axis of the input matrix consists of diagnostic and medication codes. The diagnostic features occupy 1029 blocks out of all 1098 International Classification of Diseases, Ninth Revision, Clinical Modification (ICD-9-CM) codes, and the medication features occupy 695 blocks out of all 830 World Health Organization-Anatomical Therapeutic Chemical (WHO-ATC) codes. The horizontal axis consists of 157 weeks (three years), and each cell is filled with visiting history of the patient. For each diagnosis code per week, the value is divided by seven (one week consist of seven days), and for each medication per week, the value is divided by 28 (assuming: one medication maximum prescribed as 4×7 days in a week). The EMR matrix data are fed to the convolutional neural network (CNN) architecture with leaky rectified linear unit (ReLU), and the static data (maximum age and sex of the patient) are fed to the artificial neural network (ANN) architecture.

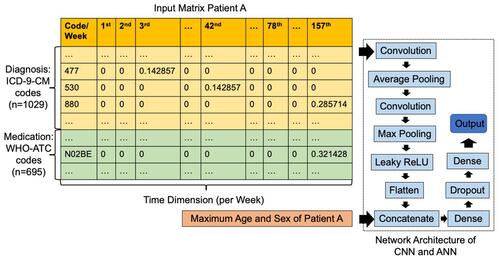
Table 1 Demographics of Sampled Dataset

Figure 2 Learning curve of Deep-KOA model using diagnosis and medication features. Based on loss and accuracy curve of training and validation vs epoch (iteration), the validation and training loss curve shown that the Deep-KOA model has less overfitting, plot of training loss (green line) decreases to point of stability and plot of validation loss (red line) decreases to point of stability and has small gap with the training loss. The training and validation dataset were representative, it is shown by small gap between plot of training loss and plot of validation loss along with plot of training accuracy (blue line) and plot of validation accuracy (orange line) also increase to point of stability and has small gap between them.

Figure 2 Learning curve of Deep-KOA model using diagnosis and medication features. Based on loss and accuracy curve of training and validation vs epoch (iteration), the validation and training loss curve shown that the Deep-KOA model has less overfitting, plot of training loss (green line) decreases to point of stability and plot of validation loss (red line) decreases to point of stability and has small gap with the training loss. The training and validation dataset were representative, it is shown by small gap between plot of training loss and plot of validation loss along with plot of training accuracy (blue line) and plot of validation accuracy (orange line) also increase to point of stability and has small gap between them.

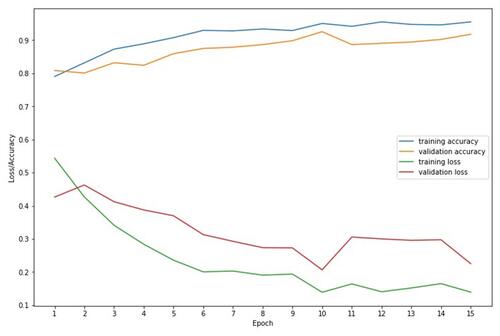
Table 2 Performance of Deep-KOA with Different Input Features

Figure 3 Area under the receiver operating characteristic curve (AUROC) of the Deep-KOA model using diagnosis and medication features, before the optimization (A) and after the optimization (B). The best threshold (dot) is 0.15, the best balance between true positive rate and false positive rate. Optimized model obtained from the TensorFlow optimization toolkit by removing some connections between nodes inside layers. After optimization, the model size decreased significantly by up to 33% from its original size (from 442 MB to 147 MB). In this case, AUROC between original and optimized model are almost the same (AUROC=0.97).

Figure 3 Area under the receiver operating characteristic curve (AUROC) of the Deep-KOA model using diagnosis and medication features, before the optimization (A) and after the optimization (B). The best threshold (dot) is 0.15, the best balance between true positive rate and false positive rate. Optimized model obtained from the TensorFlow optimization toolkit by removing some connections between nodes inside layers. After optimization, the model size decreased significantly by up to 33% from its original size (from 442 MB to 147 MB). In this case, AUROC between original and optimized model are almost the same (AUROC=0.97).

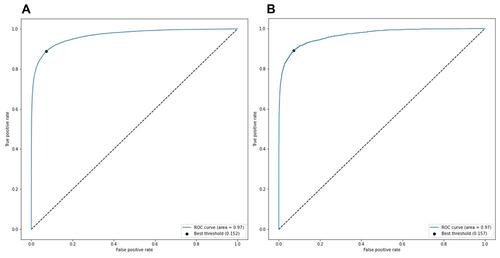
Table 3 Important Features in Deep-KOA Model for Prediction of Knee Osteoarthritis (KOA)

Table 4 Patient Data Sample for Deep-KOA Model Evaluationa