Figures & data
Table 1 Descriptive Statistics of the Study Participants
Table 2 Number of CT Examinations Before and After Implementing of Data Management Software (Stratified by Body Region)
Figure 1 Comparison of overall computed tomographic exposure parameters between pre- and post-The introduction of rectifying measures. SSDE (A), CTDI (B), and DLP (C). Lines represent the average.
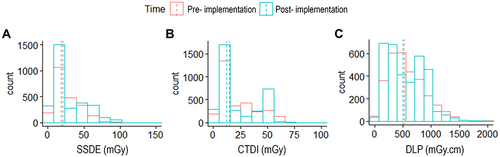
Table 3 Radiation Exposure Indices by Imaged Body Region
Figure 2 CT indices pre- and post-implementation of corrective measures based on imaged body region. SSDE (A), CTDI (B), and DLP (C). Overlapping bars from both time points indicate the difference in exposure between the two time points.
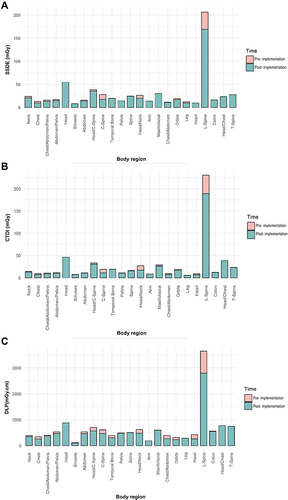
Figure 3 CT indices pre- and post-implementation of corrective measures based on imaging protocol. SSDE (A), CTDI (B), and DLP (C) (only protocols that were performed more than 10 times were included). Overlapping bars from both time points indicate the difference in exposure between the two time points.
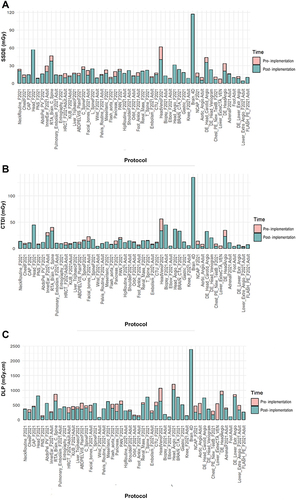
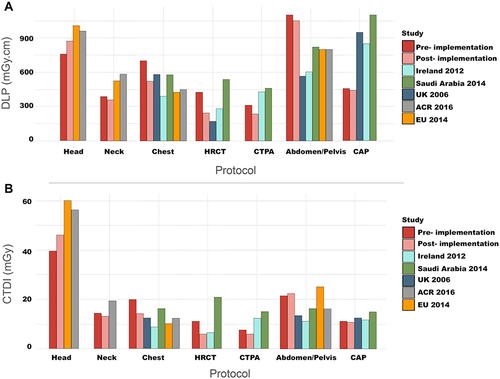
Figure 4 Exposure parameters (ie, DLP (A) and CTDI (B)) used in our radiology department compared to national.Citation7,Citation10 and international used parameters; from Ireland,Citation11 United Kingdom,Citation12 United States (American College of Radiology (ACR)),Citation3 and European countries.Citation3,Citation13.