Figures & data
Figure 1 Design of nutritional education intervention on nutritional knowledge, healthy eating index, and biochemical profile.
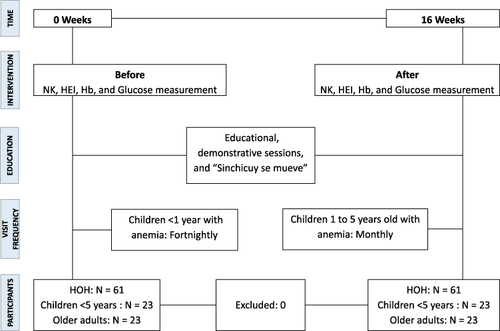
Table 1 Topics of Educational Sessions Conducted in the Nutritional Intervention
Table 2 Sociodemographic Characteristics, KN, and HEI Before and After the Program
Table 3 Mean, Standard Deviation, Distribution, Difference of Nonparametric Measures, and Effect Size of NK and HEI of the Head of Household Before and After the Nutritional Education Intervention
Figure 2 Level of NK before and after the intervention program.
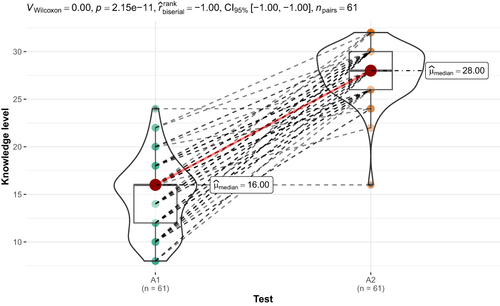
Figure 3 HEI before and after the nutrition education intervention program.
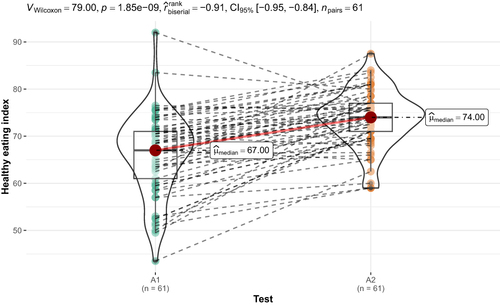
Table 4 Mean, Standard Deviation, Distribution, Nonparametric Measures Difference, and Effect Size of Glucose and Hb Level in Children and Older Adults
Figure 4 Hb level of children under 5 years of age before and after the intervention program.
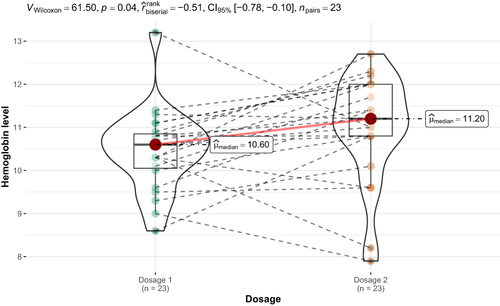
Figure 5 Hb level of older adults before and after the intervention program.
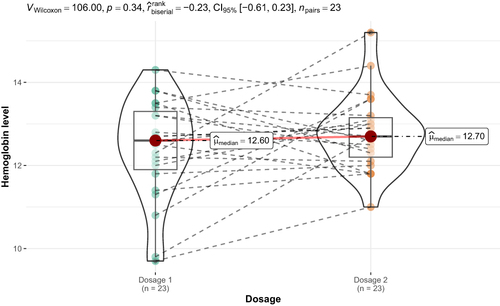
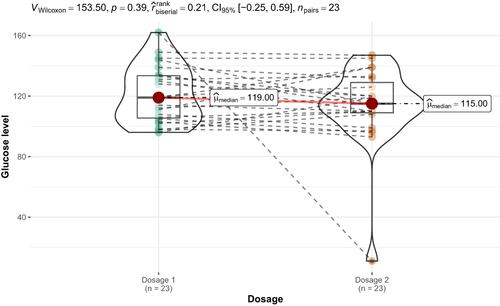
Figure 6 Glucose level of older adults before and after the intervention program.