
Figures & data
Table 1 Participant Characteristics by Race/Ethnicity (N=1485)a
Table 2 Care-Seeking Frequency, Decision Preference, and Experience by Race/Ethnicity (N=1485)a
Figure 1 Ratios of Regularly Seeing HCP by Race/Ethnicity (N=1,485)a..
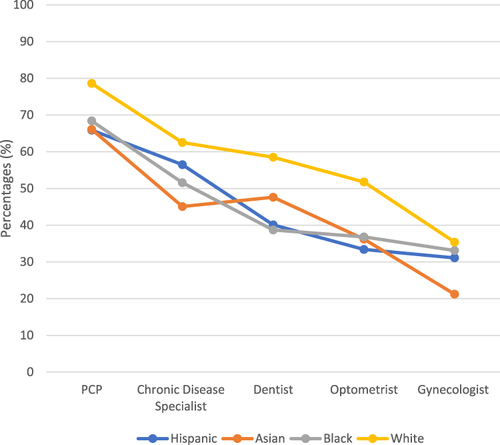
Table 3 Care-Seeking Frequency, Decision Preference, and Experience by SES (N=1485)a
Figure 2 Ratios of Regularly Seeing HCP by SES (N=1,485)a. a Participants were asked whether they regularly see each of the five HCPs. Of the total 1,485 participants, one responded “prefer not to answer” for the education question and 40 for the income question; they were excluded from this comparison. The resulting subgroup sizes and definitions were Low-Education=361 (≤ high school), Medium-Education=401 (some college), High-Education=722 (≥ college degree), Low-Income=564 (≤ US$49,999), Medium-Income=420 (US$50,000–99,999), and High-Income=461 (≥ US$100,000), of which the reported percentages are calculated from, respectively. For chronic disease specialist: Participants who reported having a chronic disease (ns) were asked whether they regularly see a specialist for it. The subgroup sizes for this category were Low-Education (ns=225), Medium-Education (ns=246), High-Education (ns=450), Low-Income (ns=353), Medium-Income (ns=245), High-Income (ns=306). For Gynecologist: Participants who did not self-identify as male (nf) were asked whether they regularly see a gynecologist. The subgroup sizes for this category were Low-Education (nf=209), Medium-Education (nf=206), High-Education (nf=342), Low-Income (nf=336), Medium-Income (nf=204), High-Income (nf=192).
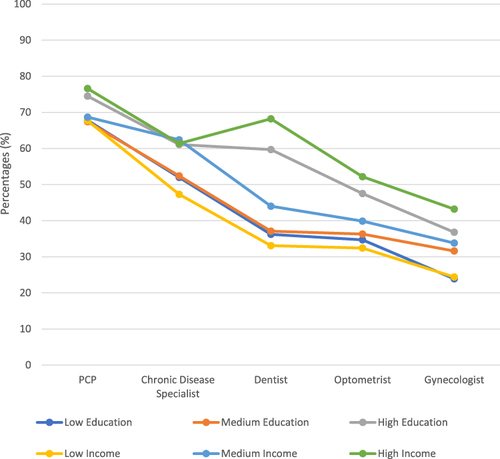
Table 4 Care-Seeking Frequency, Decision Preference, and Experience Across Race/Ethnicity by SES – Pairwise Significance (N=1485)a
Data Sharing Statement
Data presented in this manuscript are available from the corresponding author on reasonable request.