
Figures & data
Table 1 No pain vs pain using the electronic Pain Assessment Tool
Table 2 No pain vs pain using the Abbey Pain Scale
Table 3 Contingency (2×2) table for accuracy statistics
Table 4 Calculations of sensitivity, specificity, accuracy, likelihood ratios, and predictive values before prevalence adjustment
Figure 1 Electronic Pain Assessment Tool (ePAT) receiver-operating characteristic curve.
Note: Data shown in the graph were based on pain prevalence of 50% (ie, after adjustment).
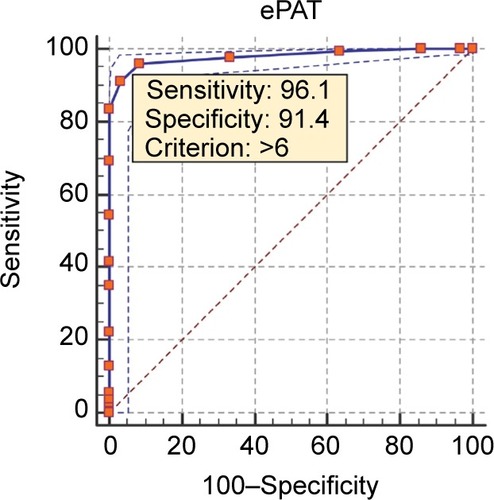
Table 5 ROC curve characteristics, optimal criterion, and calculated sensitivity and specificity after prevalence adjustment