Figures & data
Figure 1 Overview of the experimental procedure.
Abbreviations: NPU paradigm, neutral predictable unpredictable threat paradigm; ASI III, Anxiety Sensitivity Index-3.
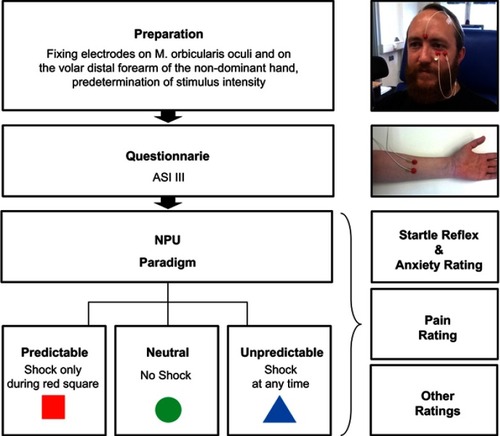
Figure 2 One single square pulse.
Abbreviation: ms, milliseconds.
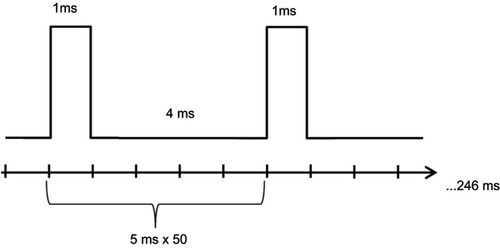
Figure 3 (A-B) Mean of startle reflex amplitudes (left) and anxiety ratings (right) in the three conditions N, P, U; *** p<0.001; ** p<0.01; * p<0.05; bars represent standard deviation; data were square root transformed.
Abbreviations: N, neutral; P, predictable; U, unpredictable; ns, not significant.
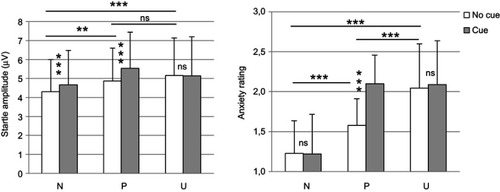
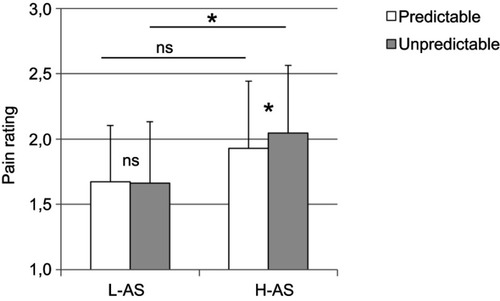
Figure 4 Mean ratings of the painfulness of the electric stimuli in the conditions P and U compared between low anxiety sensitive subjects (L-AS) and high anxiety sensitive subjects (H-AS); * p<0.05; bars represent standard deviation; data were square root transformed.
Abbreviation: ns, not significant.