
Figures & data
Figure 1 An example run of the stop-signal task, consisting of three trials. Participants’ task was to indicate the target shape (circle or a square) via button presses on go trials; on stop trials, signaled by a blue frame appearing around the target shape, no response should be given. SSD denotes stop-signal delay, please see explanation in text.
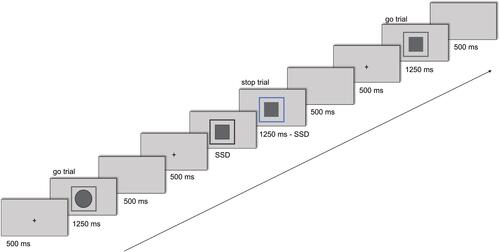
Figure 2 Scatterplot of ∆PPT after aerobic bicycling exercise at the hand and stop-signal reaction times, depicting a moderate negative correlation of (r = −0.35, 95% CI: −0.57; −0.08, p = 0.021). Note that shorter stop-signal reaction times represent better cognitive inhibition. Scatterplots for all other correlations are displayed in Figures S1–S7.
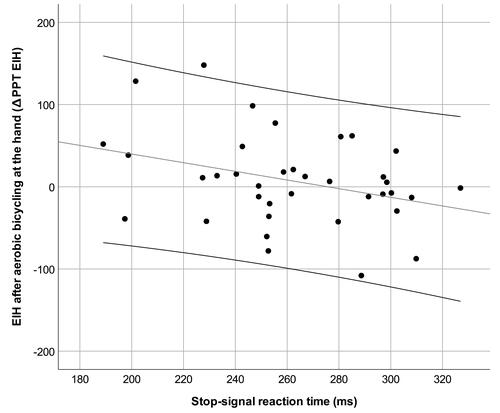
Table 1 Mean ± SD and Range for the Main Dependent Measures Directly Observed in the Stop-Signal Task, Reported Separately for Participants Included in (versus Excluded from) Subsequent Analyses
Table 2 Change Scores (Δ), Displayed in Mean ± SD for PPT and TSP from Before to After Aerobic Bicycling and Isometric Knee Exercises, as Well as the Quiet Rest Control Condition, as Assessed at the Hand and the Leg with Significance and Effect Sizes (Cohen’s d) for Tests of the Difference Between Exercises and Quiet Rest
Table 3 Correlation Coefficients with 95% Confidence Intervals (95% CI) and p-values Between Stop-Signal Reaction Times (SSRT) and ∆PPT and ∆TSP for Each Exercise and Assessment Site. Scatterplots for Each Correlation are Displayed in Figures S1–S7