
Figures & data
Table 1 Patient Characteristics (Severe Pain Subgroup, ITT Population)
Figure 1 Participant flow (severe pain subgroup).
Abbreviations: ITT, intention-to-treat; IV, intravenous; SAT, standard analgesic treatment.
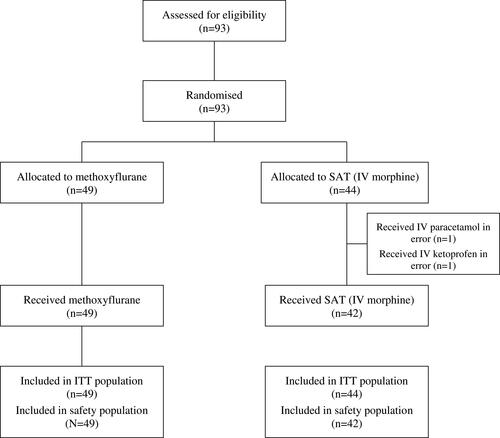
Table 2 Analysis of Change from Baseline in VAS Pain Intensity (Severe Pain Subgroup, ITT Population)
Figure 2 Change from baseline in VAS pain intensity (severe pain subgroup, ITT population). Mean change ± standard error.
Abbreviations: ITT, intention-to-treat; SAT, standard analgesic treatment.
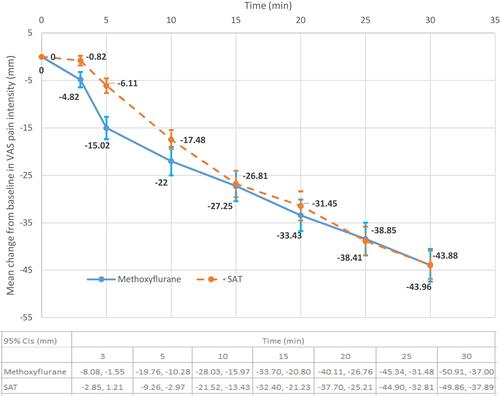
Figure 3 VAS responder rate (severe pain subgroup, ITT population). VAS responder: patient with ≥30% reduction from baseline in VAS pain intensity.
Abbreviations: ITT, intention-to-treat; SAT, standard analgesic treatment; VAS, visual analog scale.
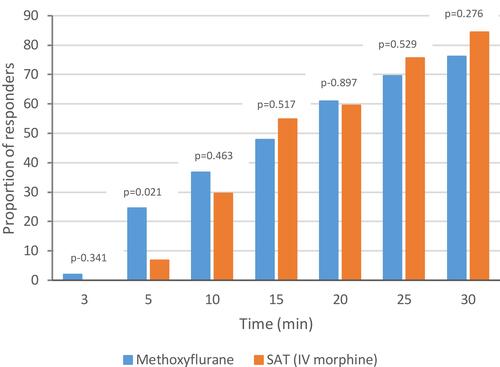
Figure 4 Kaplan-Meier plot of time to onset of pain relief (severe pain subgroup, ITT population). The Kaplan-Meier curve represents an estimate of the cumulative proportion of patients who have not yet experienced onset of pain relief. Higher curves indicate longer time to pain relief. No censoring was performed.
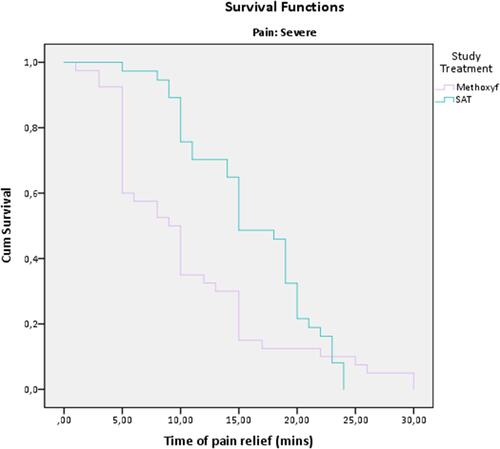
Figure 5 Patient and physician-reported outcomes (severe pain subgroup, ITT population). (A) Overall treatment efficacy evaluated by the patient. (B) Practicality of using study treatment evaluated by the physician.
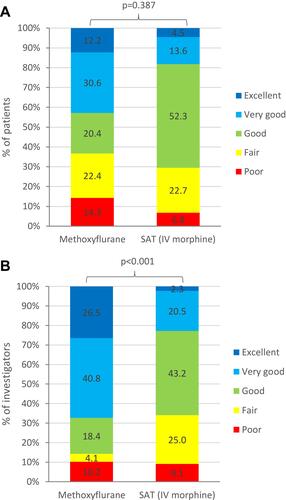
Table 3 Adverse Events (Severe Pain Subgroup, Safety Population)