
Figures & data
Table 1 Comparison of the Demographic Characteristics Data Between Two Groups ()
Figure 1 Contrast-enhanced ultrasonography demonstrates the blood perfusion of the multifidus muscle microcirculation.
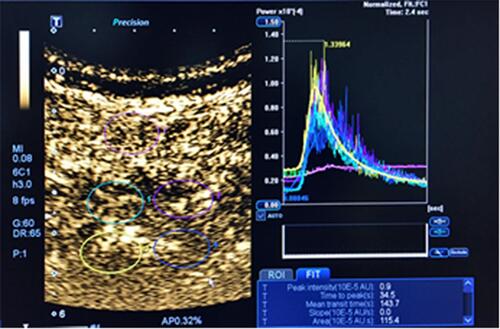
Figure 2 Fluoroscopic insertion of guide pins. (A) the primary guide pin (left), the front end of which is threaded design, which can be firmly fixed in the pedicle, and the position of the primary guide pin is easily recognized under fluoroscopy; the primary guide pin is percutaneously inserted into the vertebral pedicle, rotating to fix (right). (B and C) C-arm anteroposterior and lateral fluoroscopy confirms that the primary guide pin enters the pedicle, and the upper edge of the thread is lower than the dorsal lateral level of the superior articular process. (image from the other patient). (D) Physical view of the specially designed SAP guider, the first guide pin and the second guide pin are connected by the connecting arch, and the second guide pin puncture angle and depth can be adjusted on the connection arch. (E and F) C-arm anteroposterior and lateral fluoroscopy confirms that the second guide pin is fixed to the posterior aspect of the superior articular process.
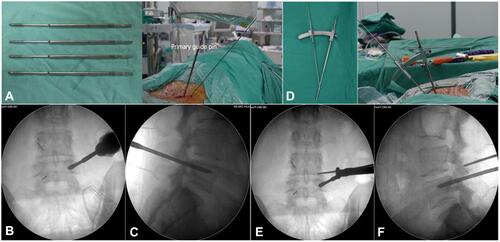
Figure 3 Resection method of the superior articular process. The hook-shaped protective sleeve clings to the lateral periosteum of the superior articular process, reaches the ventral side of the articular process, protects the exiting nerve root and can control the cutting depth of the trephine at the same time, protects the dura mater and nerve root, and rotates the trephine to remove the superior articular process.
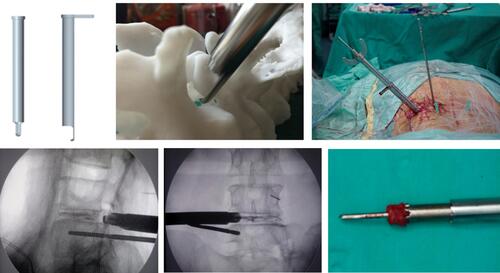
Figure 4 Bone graft bed preparation. The width adjustable reamer and endplate curette are used to prepare the cartilage endplate to adequately expose the bony endplate. Finally, Intervertebral space is fully prepared and the appearance of exudation from bone endplate is good, the bony endplate is fully exposed.
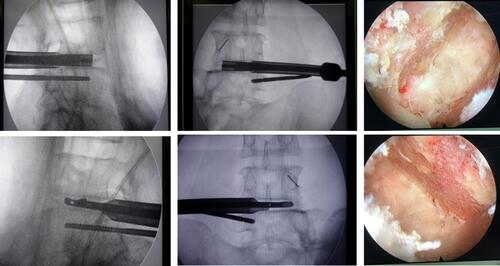
Figure 5 Intervertebral bone graft and interbody fusion device implantation. (A–C) Expandable cage, the autogenous bone, and allogenic bone are prepared for implantation. (D and E) The height-adjustable interbody cage is positioned at the center of the interbody space in the anteroposterior radiograph, and the leading edge reaches the position of the iliac crest. (F) The expandable cage is confirmed in a satisfactory position under endoscopy. Nerves are not compressed by bone graft particles.
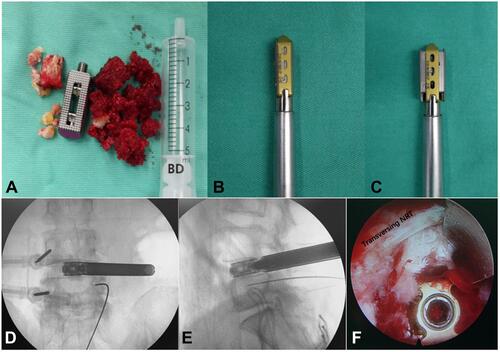
Table 2 Comparison of the Clinical Effects of Patients in Two Groups ()
Table 3 Comparison of Indicators Related to Efficacy Evaluation Between Two Groups ()
Figure 6 PE-TLIF group (A–G): A 63-year-old female patient who suffered low back pain with right leg pain and numbness for 3 years, intermittent claudication 50m, and was treated by PE-TLIF. (A and B) Preoperative MRI showed a lumbar spinal stenosis on L4/5. (C and D) X-ray images showed a good implantation position at 7 days after operation. (E) CT scan image showed a standard lumbar fusion at 6 months after operation. (F and G) X-ray images showed a good implantation position at final follow-up. PLIF group (H–N): A 52-year-old female patient who suffered low back pain with right leg pain and numbness for 2 years, intermittent claudication 100m, and was treated by PLIF. (H and I) Preoperative MRI showed a lumbar spinal stenosis on L4/5. (J and K) X-ray images showed a good implantation position at 7 days after operation. (L) CT scan image showed a standard lumbar fusion at 6 months after operation. (M and N) X-ray images showed a good implantation position at final follow-up.
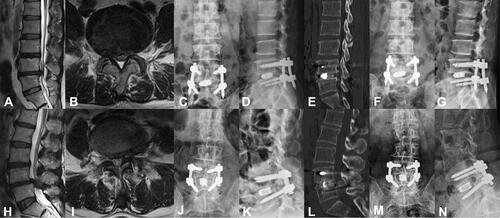
Table 4 Comparison of Indicators Related to Multifidus Injury Between Two Groups ()