Figures & data
Figure 1 Effect of EBR on (A) fasting blood glucose concentration, (B) body weight gain. Data was presented as the mean ± SD (n = 6). **P<0.05 vs HNC group, ##P<0.05 vs DC group.
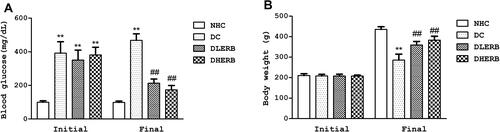
Figure 2 Effect of EBR on alleviating thermal hyperalgesia, cold, mechanical allodynia and improving motor coordination activity in DPN rats. (A) PWL of the hot plate test, (B) TWL of the tail flip test, (C) cold paw withdrawal latency (D) paw withdrawal latency measured by Von Frey filament (E) rotarod test. Data was presented as the mean ± SD (n = 6). **P<0.05 vs HNC group, ##P<0.05 vs DC group.
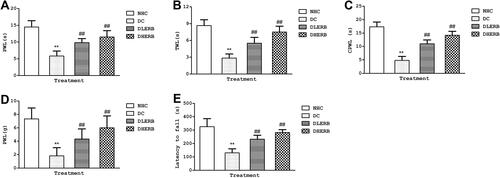
Figure 3 Effect of EBR on alleviating nociceptive responses in DPN rats. (A) Paw licking duration tested by formalin test (B) number of abdominal writhing tested by acetic acid test. Data was presented as the mean ± SD (n = 6). **P<0.05 vs HNC group, ##P<0.05 vs DC group.
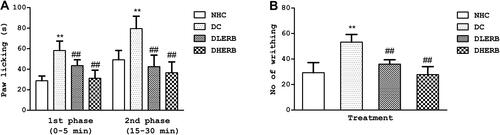
Figure 4 Effect of EBR on alleviating serum proinflammatory cytokines in DPN rats. (A) Tumor necrosis factor alpha (B) interleukin 1 beta. Data was presented as the mean ± SD (n = 6). **P<0.05 vs HNC group, ##P<0.05 vs DC group.
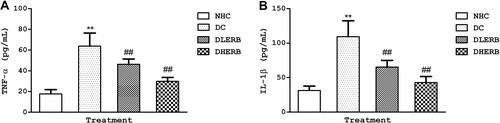
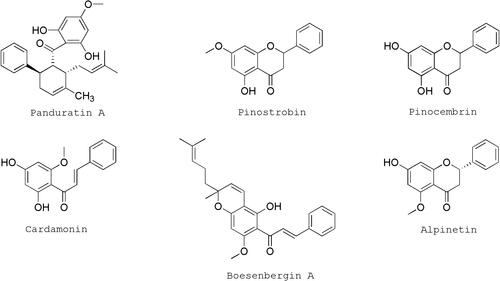
Figure 5 Chemical structure of the isolated polyphenolic compounds from EBR extract.