Figures & data
Figure 1 Effect of acupotomy on intra-articular pressure. The mean resting pressure in each knee. **P < 0.01 vs the Normal group. ##P < 0.01 vs the KOA group.
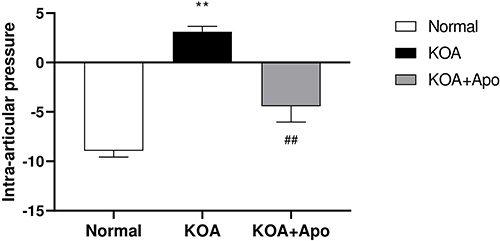
Figure 2 Acupotomy relieved the state of hypoxia. (A) Representative T2* images and pseudo-color T2* images and pseudo-color R2* images in each group. And ROIs used to delineate the synovium to derive reactivity maps of normoxia and hyperoxia (using a mixture of 95% oxygen (O2) and 5% carbogen (CO2) for hyperoxia stimulus). (B) Δ R2* changes between groups. *P < 0.05 vs the Normal group. (C) R2* changes between groups. **P < 0.01 vs the Normal group. ##P < 0.01 vs the KOA group.
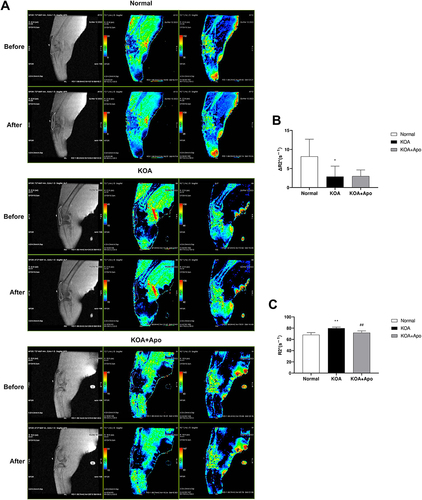
Figure 3 Acupotomy reduced the expression of HIF-1α in rabbit synovial tissue. (A) Representative HIF-1α IHC sections of synovial tissues in each group, 200×. (B) Relative IOD value in each group. Semiquantification of IHC sections was evaluated by calculating the positive areas of HIF-1α. Data were analyzed by Image J Pro Plus 6.0. **P <0.01 vs the Normal group. ##P < 0.01 vs the KOA group. (C) Typical protein bands of HIF-1α. (D) Protein level comparison of HIF-1α between groups. **P < 0.01 vs the Normal group. #P < 0.05 vs the KOA group. Data were analyzed by Image J.
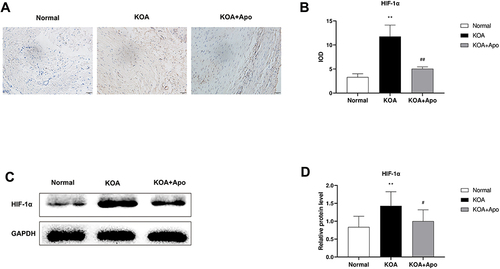
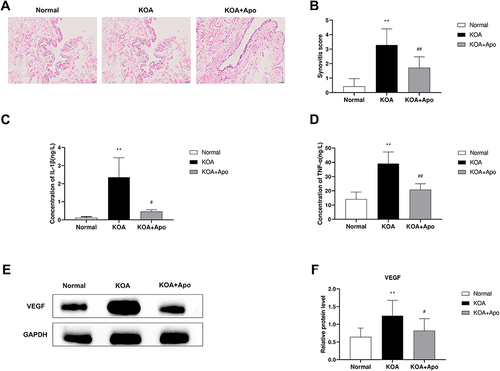
Figure 4 Acupotomy improved synovial inflammation and angiogenesis. (A) Representative synovial tissues of each group stained with HE staining, 200×. (B) Krenn pathological scale in each group. **P < 0.01 vs the Normal group. ##P < 0.01 vs the KOA group. (C and D) The concentration of IL-1β and TNF-α in rabbits in each group. **P < 0.01 vs the Normal group. #P < 0.05, ##P < 0.01 vs the KOA group. (E) Typical protein bands for each group. (F) Protein level comparison of VEGF between groups. **P < 0.01 vs the Normal group. #P < 0.05 vs the KOA group. Data were analyzed by Image J.