
Figures & data
Table 1 Demographic and Clinical Data of Patients
Table 2 Resting-State Functional Connectivity of the Nucleus Accumbens
Figure 1 Group-differences of the resting-state functional connectivity of the left NAc. Higher (blue) and lower (red) resting-state functional connectivity was found in the patients with cLBP compared to the HC.
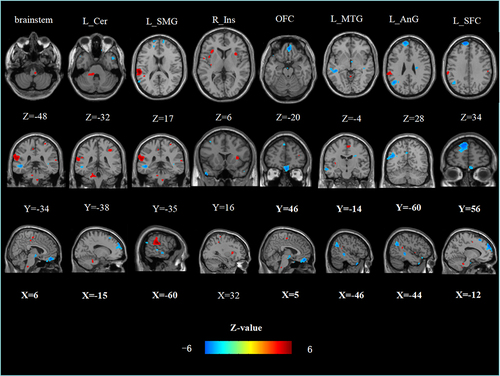
Figure 2 Group-differences of the resting-state functional connectivity of the right NAc. Higher (blue) and lower (red) resting-state functional connectivity was found in the patients with cLBP compared to the HC.

Table 3 Resting-State Functional Connectivity of the Nucleus Accumbens Subregions
Table 4 The Effective Connectivity of the Nucleus Accumbens
Figure 3 Effective connectivity of the NAc. (A) Locations of brain regions used in the dynamic causal modelling. (B) Five models used in the DCM analysis. (C) Results from Bayesian model selection; the single-group level t-test showed that the fully connected model was the best model for the two groups.
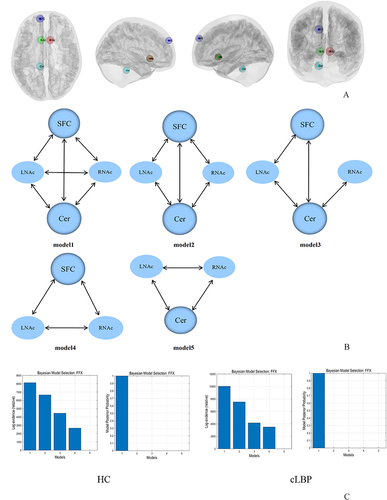
Figure 4 The winning model and the connectivity parameters for the two groups. The solid lines represent connectivity values greater than 0.1 Hz, the dotted lines represent the connectivity values below 0.1 Hz, and their thickness reflects the size of the value. The red round represents the significant group differences between cLBP and HC.
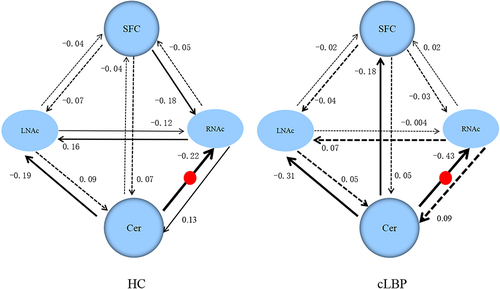
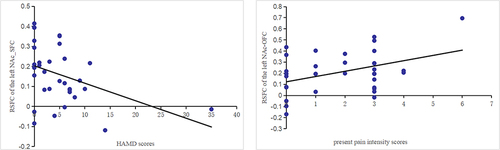
Figure 5 Results of the correlation analysis. There was a significant negative correlation between the rsFC values of the left NAc-SFC and HAMD scores (r = −0.402, p = 0.018), a significant positively correlation between the rsFC values of the left NAc-OFC and the present pain intensity scores (r = 0.406, p = 0.017) in patients group.
Data Sharing Statement
The data of the 68 participants are in-house dataset and are available from the corresponding author upon reasonable request.