Figures & data
Figure 1 EEG-based frequency analysis using (A) NeuralScan by Medeia showing demo results of: (B) Resting EEG (Eyes Open and Eyes Closed) and Theta/Beta ratio, (C) Visual and Auditory processing, Working Memory and Attention and (D) Theta/Beta ratio, Visual and Auditory processing, Working Memory, Attention Reaction Time (RT) and Reaction Time Variability (RTV).
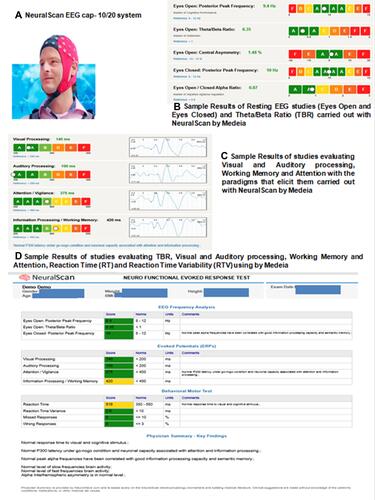
Figure 2 (A) ADHD and its cross-border co-morbidities: Illustration of symptom sharingandsymptoms unique.Citation6,Citation7 Percentage of Individuals with ADHD and selected symptom sharing (cross-border) psychiatric comorbidities (Citation32).
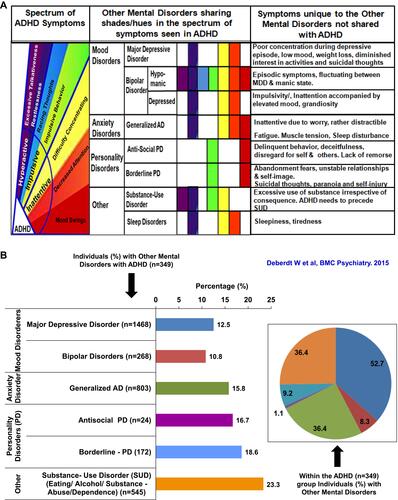
Figure 3 Correlation illustrating the shared genetics of adhd with selected psychiatric co-morbidities and behavioral-cognitive phenotypes.
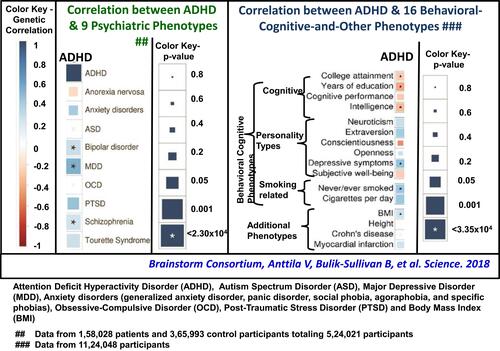
Table 1 Analytic Approach Followed to Review EEG-Based Cognitive Studies on ADHD from 2000 to 2017
Table 2 Neurocognitive Domains and the ERP Components Elicited via Appropriate Paradigms in EEG-Based Cognitive Studies on ADHD from 2000–2017
Figure 4 Attention among controls and individuals with self-reported ADHD captured via P3 following Go/NoGo Task Note: Adapted from Rodriguez PD, Baylis GC. Activation of brain attention systems in individuals with symptoms of ADHD. Behav Neurol. 2007;18(Citation2):115–30. Creative Commons license and disclaimer available from: http://creativecommons.org/licenses/by/4.0/legalcode”http://creativecommons.org/licenses/by/4.0/legalcode.Citation141
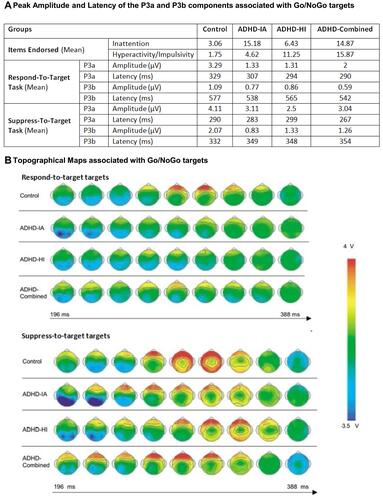
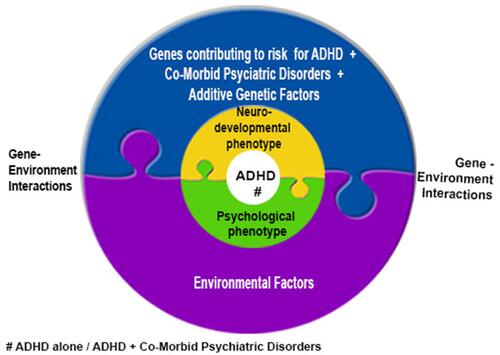
Figure 5 Diagrammatic illustration of the contributing factors to clinical phenotypic presentation of ADHD.