
Figures & data
Table 1 Summary of Included Studies
Figure 1 Flow diagram of study identification, exclusion and inclusion in the analysis.
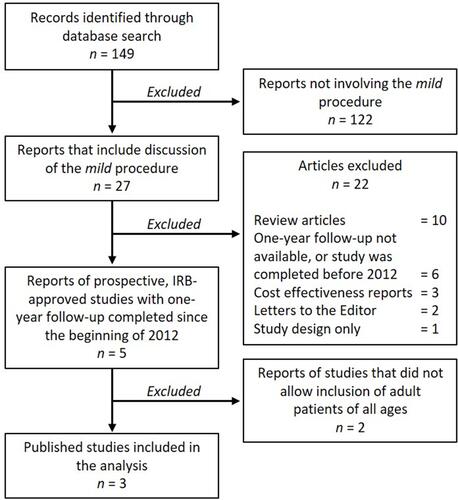
Table 2 Descriptive Statistics for Included Studies
Figure 2 Change in outcomes with time within the adult group for (A) VAS, (B) ODI, (C) PDI, (D) Standing time, (E) RMQ, and (F) Walking distance.
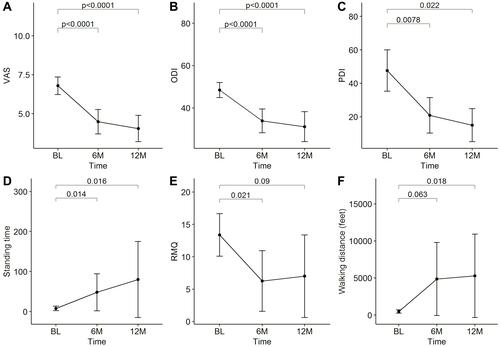
Figure 3 Change in outcomes with time within the older adult group for (A) VAS, (B) ODI, (C) PDI, (D) Standing time, (E) RMQ, and (F) Walking distance.
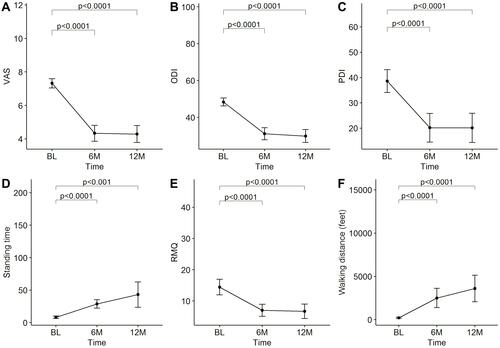
Table 3 Descriptive Analysis and LMM Interaction Results
Figure 4 Change in outcomes across adult and older adult groups for (A) VAS, (B) ODI, (C) PDI, (D) Standing time, (E) RMQ, and (F) Walking distance.
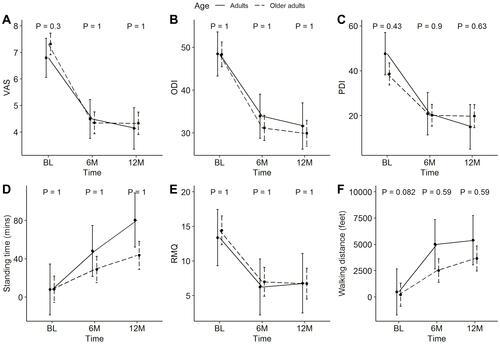
Figure 5 Correlation between age and % change in VAS at (A) 6 months and (B) 12 months.
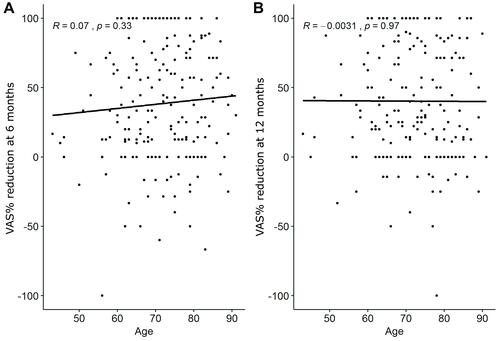
Table 4 VAS Linear Regression Analysis: Percent Reduction in Pain Does Not Change with Age