Figures & data
Figure 1 Stimulus instruments.
Notes: Left is rPMS and right is TES. Both instruments were portable and easy to use.
Abbreviations: rPMS, repetitive peripheral magnetic stimulation; TES, transcutaneous electrical current stimulation.
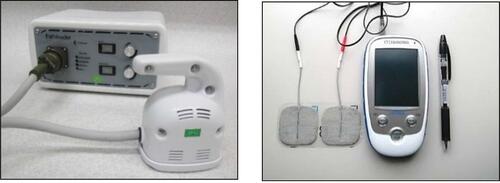
Table 1 Experimental Conditions
Figure 2 Definitions of the analytical parameters.
Abbreviations: AS, analysis section from 0 to 2 seconds; σ, integral value of wrist joint angle during; deg, degree.
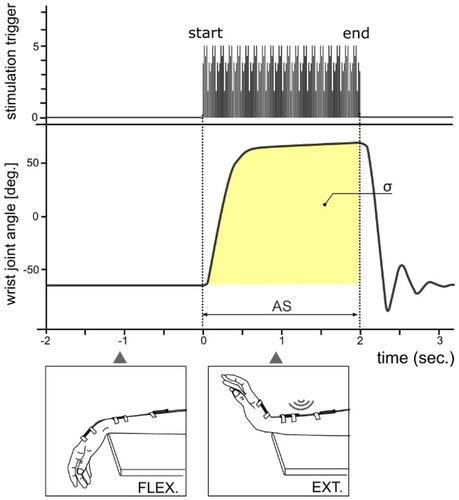
Figure 3 An example of a subject’s regression curve using the sigmoid function.
Notes: (A) is rPMS and (B) is TES. X-axis shows stimulus intensity, which the unit of rPMS is “%” and it of TES is “mA”. Y-axis shows iROM, which the units are “°s”. Both rPMS and TES condition, stimulus intensity and iROM were strongly correlated using by regression curve of sigmoid function.
Abbreviations: rPMS, repetitive peripheral magnetic stimulation; TES, transcutaneous electrical current stimulation; iROM (°s), integrated range of movement (degree multiplied by second).
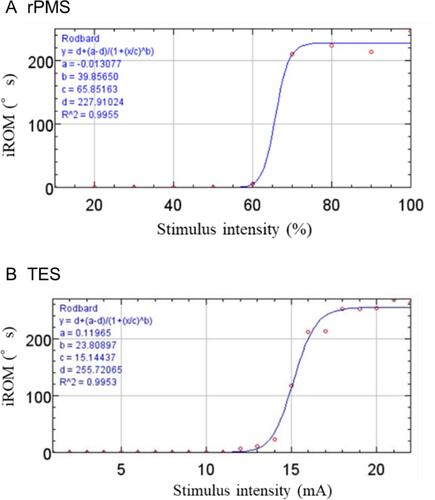
Figure 4 Pain caused by the differences in the integral value of the wrist movements and the stimulus conditions.
Notes: The two-factor repeated measures analysis of variance (ANOVA) revealed significant main effects with respect to both the types of stimulus devices and the iROM. ×, mean value; -, median value; *p < 0.05; **p < 0.01.
Abbreviations: NRS, numerical rating scale; iROM (°s), integrated range of movement (degree multiplied by second); rPMS, repetitive peripheral magnetic stimulation; TES, transcutaneous electrical current stimulation.
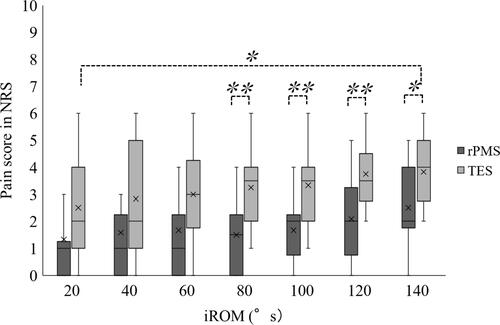
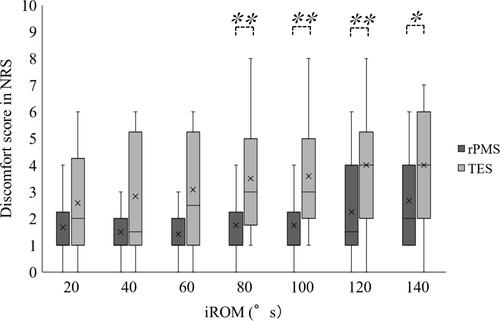
Figure 5 Discomfort caused by the differences in the integral value of the wrist movements and the stimulus conditions.
Notes: The two-factor repeated measures analysis of variance (ANOVA) revealed significant main effects with respect to both the types of stimulus devices and the iROM. ×, mean value; -, median value; *p < 0.05; **p < 0.01.
Abbreviations: NRS, numerical rating scale; iROM (°s), integrated range of movement (degree multiplied by second); rPMS, repetitive peripheral magnetic stimulation; TES, transcutaneous electrical current stimulation.