Figures & data
Figure 1 A schematic presentation of the Peracutus Aqua Meth.
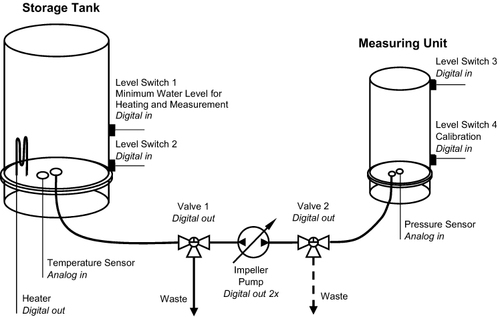
Figure 2 Profile of cross-sectional areas of a PVC pipe with socket and cap. Remarkable features in the graph are indicated (see text and and ).
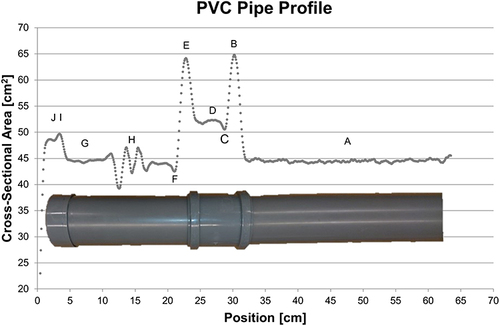
Table 1 Comparison of Cross-Sectional Areas Measured with the PAM and with a Caliper
Table 2 Overshoot of Signals Due to Abrupt Discontinuities on the Object
Figure 3 Profiles of cross-sectional areas of arms of two mannequins. Only the first of 10 measured profiles are presented.
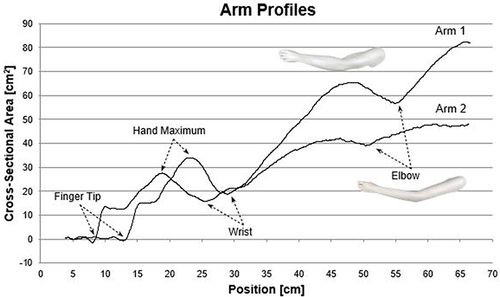
Table 3 Calculated Mean Volumes Between Two Chosen Positions of Arms 1 and 2
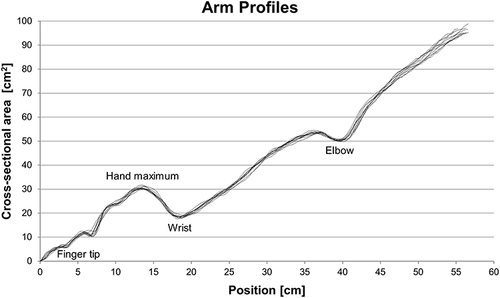
Figure 4 Ten profiles of cross-sectional areas of the left arm of a voluntary test subject. The profiles have been aligned by setting the finger tips of all profiles at 0.