Figures & data
Figure 1 Schematic presentation of the experimental setup. Test materials were incubated in 3 mL tubes containing 2 mL of a proprietary cell culture medium and 1 mL of human whole blood, either in a block thermostat (static culture), as common for TruCultures, or periodically resuspended in a sample mixer (rotated culture). The human whole blood cultures provide an interaction of all blood components (immune cells) with the test materials in an in-vivo-like manner. If necessary, an inert sample holder was used to ensure proper contact between test material and immune cells. The figure shows a 3 mL tube after sedimentation of whole blood components (A) and the experimental setup either in the static or the rotated system, as well as a simplified illustration of the interaction of immune cells during the incubation in the whole blood cultures (B).
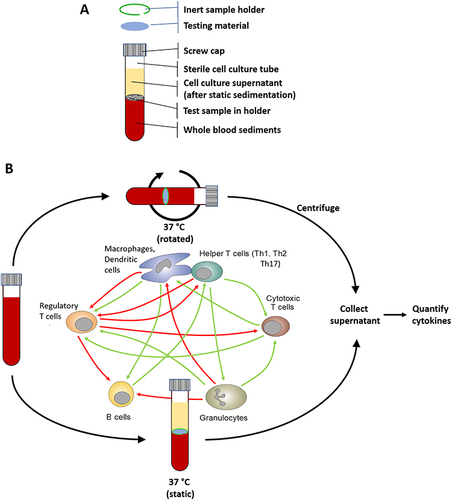
Figure 2 Comparison of static versus rotated whole blood cultures. Human whole blood was cultured without stimulation (non-stim.), or in the presence of either high-density polyethylene (HDPE; material control) as negative control, NelA (positive control), or LPS/SEB as stimulation control. Samples were cultured either in the static manner (white boxes) or under rotation (grey boxes). Supernatants were examined by multiplex immunoassays for the concentrations of different cytokines. Boxplots with single values of eight independent runs, using the blood of three varying healthy donors for each run (N = 24). Statistical differences were determined using two-way ANOVA followed by Šídák’s multiple comparison test (****p < 0.0001). Significant differences for the static model are not shown.
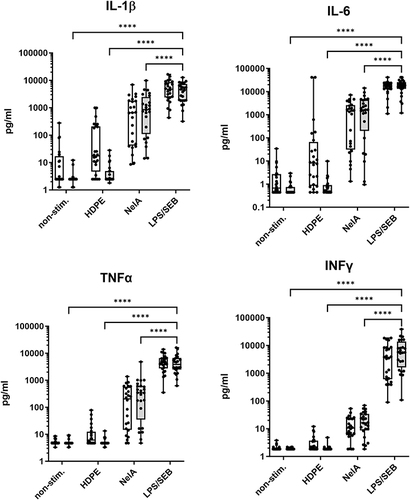
Figure 3 Comparison of static versus rotated whole blood cultures. Shown are the immunoregulatory cytokines MCP-1, MIP-1β, IL-10 and IL-1RA. In accordance with boxplots show single values of eight independent runs, using the blood of three varying healthy donors for each run (N = 24). Statistical differences were determined using two-way ANOVA followed by Šídák’s multiple comparison test (***p < 0.001, ****p < 0.0001). Significant differences for the static model are not shown.
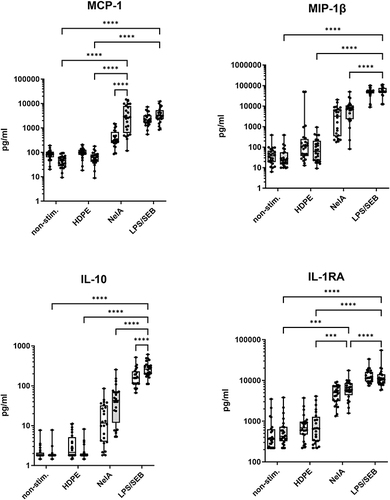
Figure 4 Macroscopic and microscopic images of the barrier membranes before or after incubation in human whole blood cultures. Three different commercially available barrier membranes used for dental, trauma, and maxillofacial surgery were used to perform proof-of-concept-experiments in the human whole blood culture system. (A) The synthetic membranes reveal a uniform smooth (PCL) or embossed perforated structure (PTFE), whereas the collagen-based barrier membrane exhibits the characteristic and typical inconsistent bi-layer surface structure reported by the manufacturer. (B) After incubation in human whole blood cultures, the PTFE membrane showed barely any changes, whereas weak or obvious red staining indicated residual erythrocyte sticking to the membrane materials was visible on the PCL or collagen membranes. (C) Acridine Orange staining showed different amounts of immune cells (yellow and Orange dots) attached to the membranes (PTFE: few; collagen: medium; PCL: high). (D) Magnified images of Acridine Orange stained immune cells showing typical segmented- or horseshoe-shaped nuclei of neutrophils (PTFE, PCL) or monocytes, respectively (Collagen).
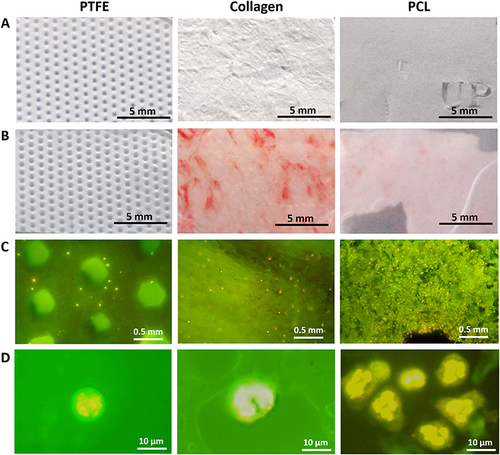
Figure 5 The rotated whole blood assay revealed distinct cytokine responses for different barrier membrane materials. Human whole blood from six healthy donors (N = 6) was cultured in the new rotated test system without stimulation (non-stim.; negative control), with barrier membranes (made of PTFE, collagen, or PCL), and NelA (positive control) or LPS/SEB (stimulation control). Subsequently, culture supernatants were analyzed by multiplex immunoassays. The graphs above show a representative selection of cytokines that can be grouped into (A) chemokines, (B) cytokines, mainly produced by myeloid cells and (C) cytokines also produced by lymphocytes. Statistical differences were determined using RM one-way ANOVA followed by Tukey’s multiple comparison test (*p < 0.05, **p < 0.01, ***p < 0.001).
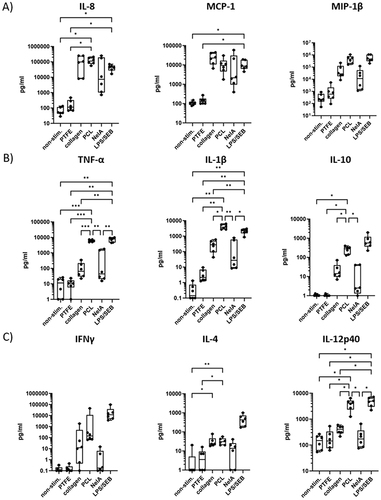
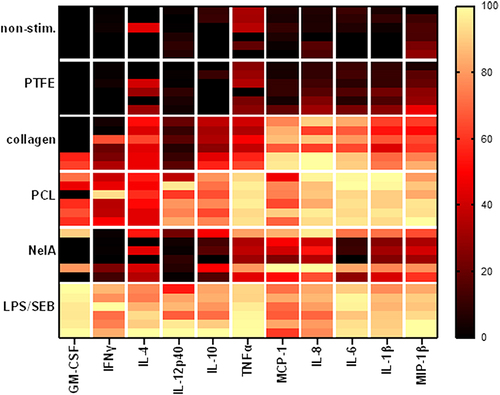
Figure 6 Heatmap analysis shows different cytokine-patterns for different materials. The assay was performed as described above. Rows of the heatmap show different conditions: non-stim. (negative control), barrier membranes (PTFE, collagen, or PCL), NelA (positive control) or LPS/SEB (stimulation control) of six different donors (stacked in each row). Columns indicate the according analyte. Data of individual values was transformed (y = ln(x + 1)), subcolumns were normalized (smallest value = 0%; largest value = 100%) and colour coded.