Figures & data
Table 1 The effect of cannabidiol (CBD) on vitamin D3 receptor (VDR) expression in terms of relative quantification (RQ) in multiple cell lines
Figure 1 Evaluation of inflammatory cytokines viz. tumor necrosis factor-alpha (TNF-α) and interleukin-6 (IL-6) after administration of cannabidiol (CBD) in the human monocytic cell line (THP-1). Values are shown as mean ± SEM with three replicates. All the treatment groups were pre-treated with lipopolysaccharide (LPS) at 10 µg/mL except the normal control. *p≤0.05, **p≤0.01, and ***p≤0.001 vs vehicle control group (DMSO, 0.05%); while #p≤0.05 and ###p≤0.001 vs normal control group using One-way ANOVA followed by Tukey’s post-hoc test.
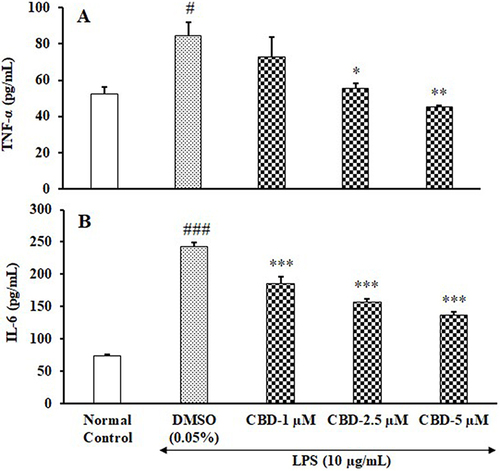
Figure 2 Evaluation of tissue elasticity in terms of mean Young Modulus (YM) after administration of cannabidiol (CBD) in rat cardiomyoblast cell line (H9C2). Values are shown as mean ± SEM with three replicates. *p≤0.05 and ***p≤0.001 vs vehicle control group (DMSO, 0.05%) using One-way ANOVA followed by Tukey’s post-hoc test.
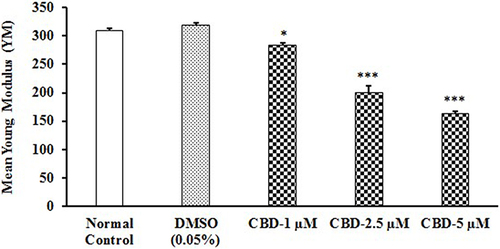
Figure 3 Evaluation of cellular senescence in terms of doubling time after administration of cannabidiol (CBD) in human lungs fibroblasts (WI-38) cell line. Values are shown as mean ± SEM with three replicates. The error bars represent the standard error of each mean. ###p≤0.001 vs normal control group; *p≤0.05, **p≤0.01, and ***p≤0.001 vs vehicle control group (H2O2) using One-way ANOVA followed by Tukey’s post-hoc test.
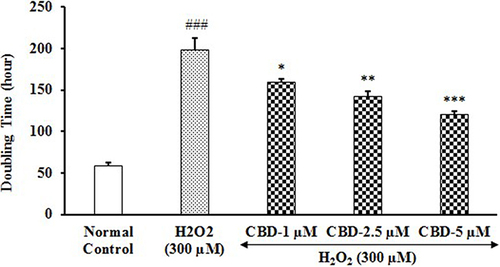
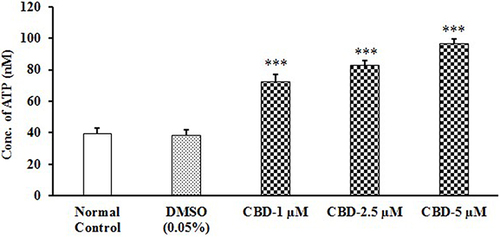
Figure 4 Evaluation of ATP concentration after administration of cannabidiol (CBD) in human osteoblast (MG-63) cells. Values are shown as mean ± SEM with three replicates. ***p≤0.001 vs vehicle control group (DMSO, 0.05%) using One-way ANOVA followed by Tukey’s post-hoc test.