
Figures & data
Table 1 Characteristics of the study sample
Figure 1 Training regime.
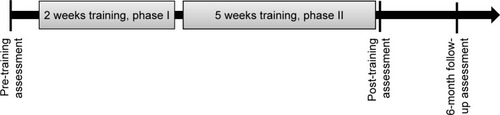
Figure 2 Participant’s monitor during feedback and transfer trials (images provided with kind permission by NeuroConn, Ilmenau, Germany).
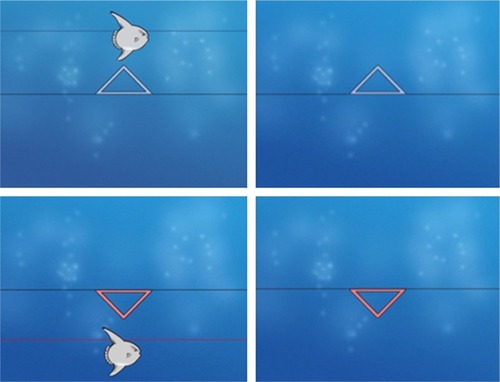
Table 2 Training protocol
Figure 3 Percentage of correctly regulated negativation and positivation feedback (A) and transfer (B) trials per session.
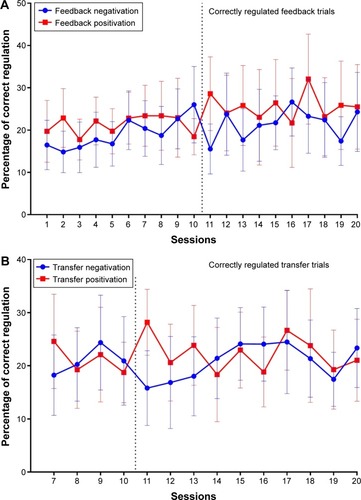
Table 3 Attentional performance before and after NF training
Table 4 Attentional performance after NF training and at follow-up
Table 5 Attentional performance before NF training and at follow-up
Figure 4 Mean auditive reaction time of the Divided Attention task before and after NF training.
Abbreviations: NF, neurofeedback; SD, standard deviation.
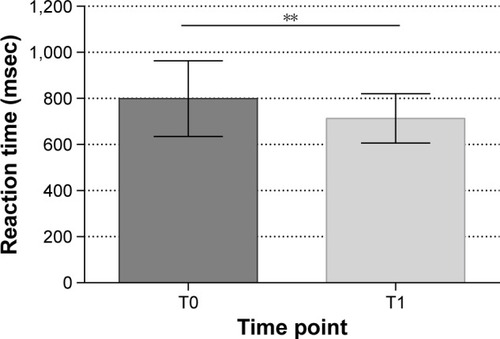
Figure 5 Mean SD of the auditive reaction time of the Divided Attention task before and after NF training.
Abbreviations: NF, neurofeedback; SD, standard deviation.
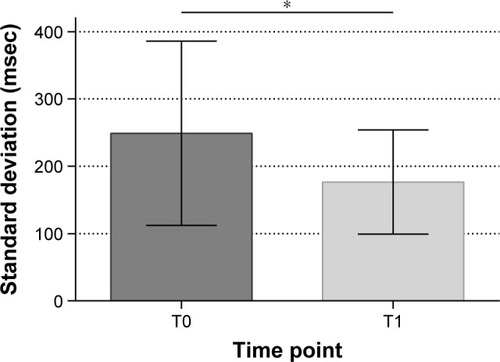
Figure 6 Number of errors in the SSvis task before and after NF training.
Abbreviations: NF, neurofeedback; SSvis, Shifting Attentional Set; SD, standard deviation.
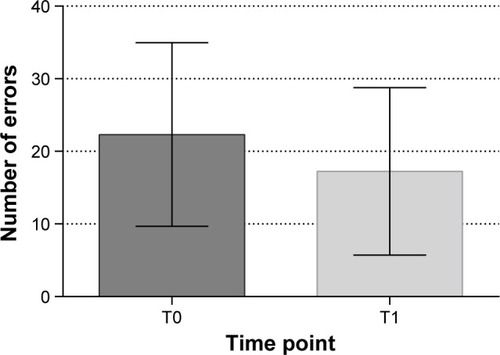
Figure 7 Number of errors in the SSvis task after NF training and at the 6-month follow-up.
Abbreviations: NF, neurofeedback; SSvis, Shifting Attentional Set; SD, standard deviation.
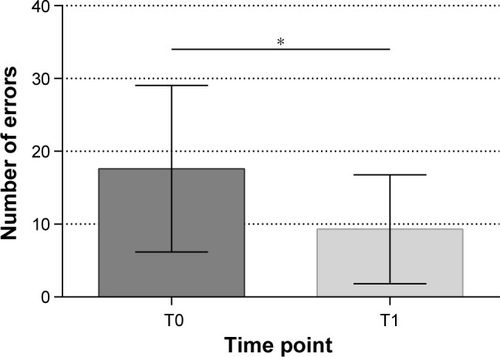
Figure 8 Mean reaction time of the SAdots task before and after NF training.
Abbreviations: NF, neurofeedback; SAdots, Sustained Attention Dots; SD, standard deviation.
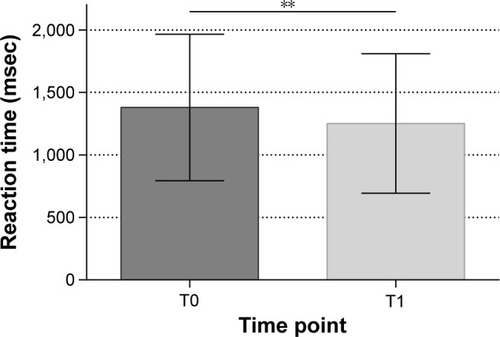
Figure 9 Mean reaction time of the SAdots task after NF training and at the 6-month follow-up.
Abbreviations: NF, neurofeedback; SAdots, Sustained Attention Dots; SD, standard deviation.
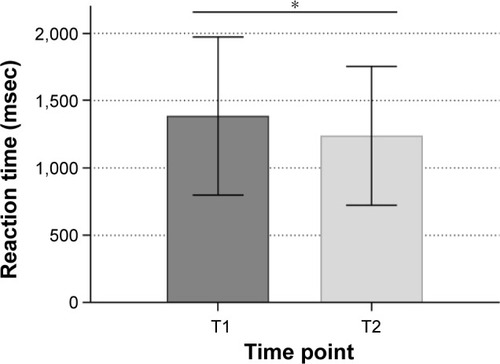
Table 6 Symptom ratings before and after NF training
Table 7 Symptom ratings after NF training and at the 6-month follow-up
Table 8 Symptom ratings before NF training and at the 6-month follow-up
Table 9 Regulation during feedback trials
Table 10 Regulation during transfer trials