Figures & data
Figure 1 (A) Typical UPLC-Q-TOF-MS TIC of hippocampus tissue from the QC sample of ESI+. (B) Typical UPLC-Q-TOF-MS TIC chromatogram of hippocampus tissue from the QC sample of ESI−.
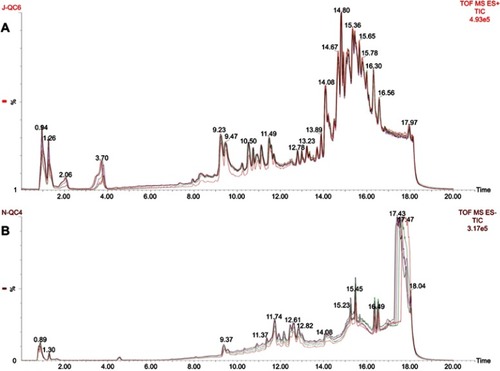
Figure 2 Multivariate statistical analysis between the LPS-induced depression and healthy Control groups at ESI+: (A) principal component analysis (PCA) scores plot; (B) partial least squares-discriminate analysis (PLS-DA) scores plot; (C) statistical validation of the PLS-DA model through 200× permutation testing; and (D) pair-wise orthogonal projections to latent structures discriminant (OPLS-DA) scores plot. Multivariate statistical analysis between the LPS-induced depression and healthy Control groups at ESI−: (E) PCA scores plot; (F) PLS-DA scores plot; (G) statistical validation of the PLS-DA model through 200×permutation testing; and (H) OPLS-DA scores plot.
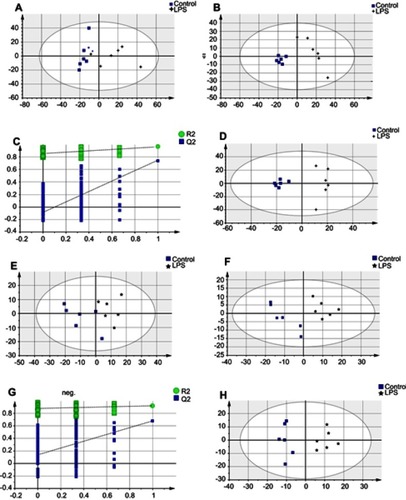
Figure 3 Multivariate statistical analysis between the LPS-induced depression and NBP treatment groups (LPS+Ding) at ESI+: (A) PCA scores plot; (B) PLS-DA scores plot; (C) Statistical validation of the PLS-DA model through 200× permutation testing; and (D) OPLS-DA scores plot. Multivariate statistical analysis between the LPS-induced depression and NBP treatment groups at ESI−: (E) PCA scores plot; (F) PLS-DA scores plot; (G) statistical validation of the PLS-DA model by 200× permutation testing, and (H)OPLS-DA scores plot.
Abbreviations: LPS, lipopolysaccharide; ESI, electrospray ionization; NBP, Dl-3-n-butylphthalide; PCA, principal component analysis; PLS-DA, partial least squares-discriminate analysis; OPLS-DA, orthogonal partial least-squares discriminant analysis.
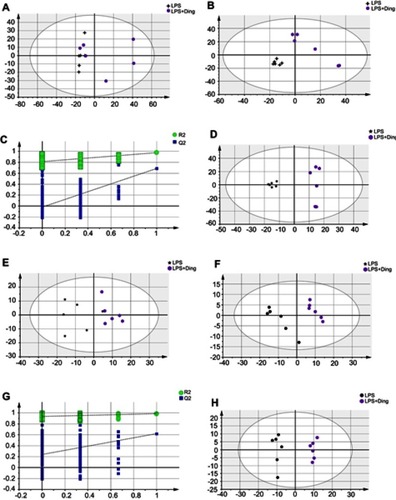
Table 1 Summary of the significantly different metabolites in the hippocampus between the LPS and Control groups at ESI+ and ESI−
Table 2 Summary of the significantly different metabolites in the hippocampus between the LPS and LPS+NBP at ESI+ and ESI−
Table 3 Result from pathway analysis from MetaboAnalyst
Figure 4 Summary of the pathway analysis using MetaboAnalyst. (A) LPS group versus Control group (B) LPS+NBP group versus LPS group.
Abbreviations: LPS, lipopolysaccharide; NBP, Dl-3-n-butylphthalide.
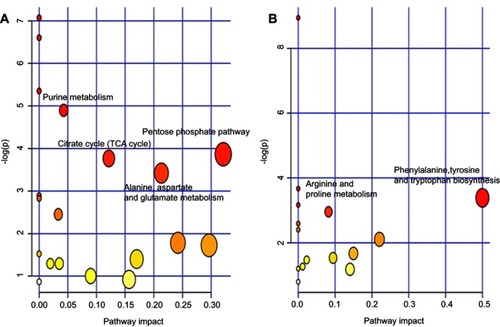
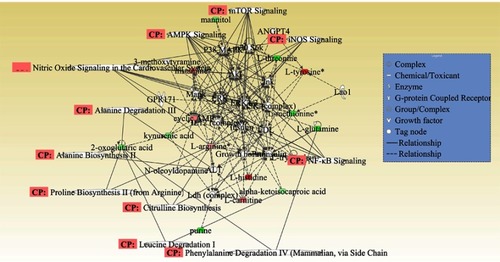
Figure 5 Merged network combining major signaling networks related to the metabolites differentially expressed in the Ingenuity Pathways Analysis.
Note: For clarity, proteins and metabolites were merged with different geometric shapes in the relevant network in the hippocampus. Red indicates upregulation of metabolites, whereas green indicates downregulation of metabolites. Metabolites not correlated to proteins and treatment are shown as clear. Dotted lines show indirect interactions or regulations between the two parties, whereas solid lines show direct physical interactions (eg, binding) of the two parties.
Abbreviation: CP, correlation of pathway.