Figures & data
Table 1 Modified Neurological Severity Score (mNSS) in rats
Figure 1 Exercise training improves the memory of intracerebral hemorrhage rats in the water maze test. (A) The mNSS score of each group after modeling. (B) Average speed of each group per day. (C) Average escape latency of each group per day in the place navigation task. (D) Percentage of time in target quadrant for each group in the spatial probe task. (E) Percentage of distance in target quadrant for each group in the spatial probe task. (F) Representative trace of spatial probe task. *P<0.05 vs. the MD group, #P<0.05 vs. the SM group.
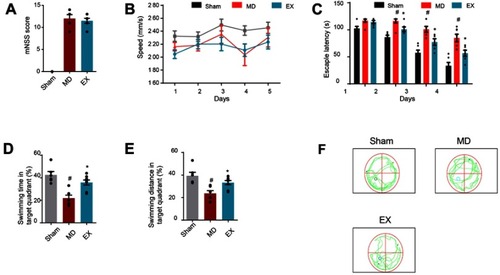
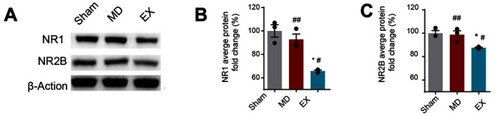
Figure 2 Exercise training reduces the level of NR1 and NR2B in the contralateralhippocampal CA3 region of intracerebral hemorrhage rats. (A) Representative image of the western blot. (B) Western blot analysis of NR1 expression. (C) Western blot analysis of NR2B expression. ##P>0.05 vs. the SM group, *P<0.05 vs. the MD group, #P<0.05 vs. the SM group.