Figures & data
Figure 1 Isolation and identification of rat cortical neurons. The expression of NSE in cortical neurons was evaluated by quantitative PCR and Western blotting. Scale bar: 100 μm.
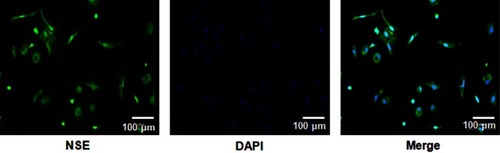
Figure 2 Evaluation of transfection efficiency. (A, B) Transfection of the Tmsb4x overexpression plasmid increased Tβ4 mRNA (A) and protein (B) levels in cortical neurons. Data shown as mean ± SD. *P<0.05 vs control.
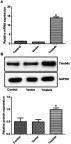
Figure 3 Tβ4 overexpression prevents OGD/R-induced apoptosis in rat cortical neurons. (A) Detection of apoptotic cells by flow cytometry. Left: representative flow cytometry plots; right: quantitative analysis. (B) Detection of apoptotic cells with the TUNEL assay. Left: representative images (apoptotic cells are green and cell nuclei are blue); right: quantitative analysis. Data shown as mean ± SD. *P<0.05 vs control; #P<0.05 vs OGD/R.
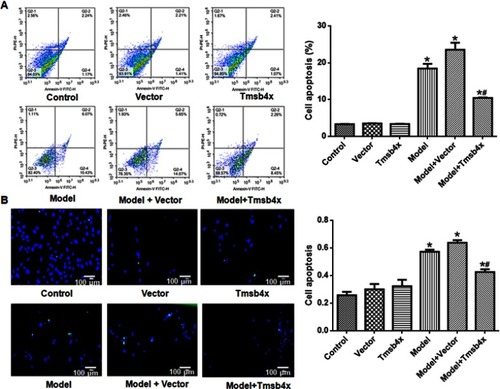
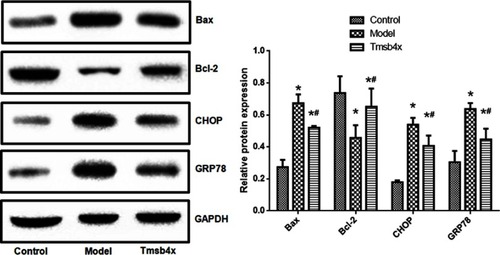
Figure 4 Tβ4 overexpression reverses OGD/R-induced changes in ER and apoptosis-related protein expression. Upper panel: representative immunoblots; lower panel: quantitative analysis. Data shown as mean ± SD. *P<0.05 vs control; #P<0.05 vs OGD/R.
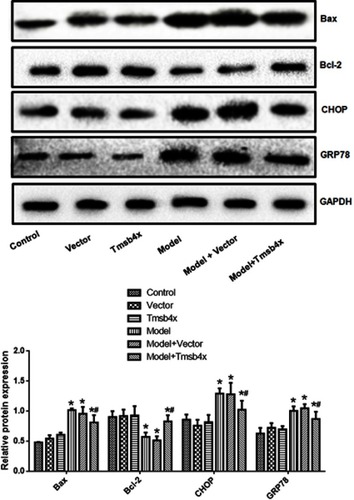
Figure 5 Tβ4 overexpression alleviates OGD/R-induced ER stress. ER structure was evaluated by TEM. Arrows indicate ER with abnormal morphology.
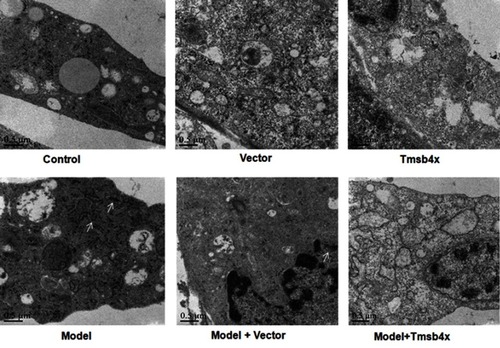
Figure 6 Exogenous Tβ4 prevents OGD/R-induced apoptosis. (A) Evaluation of cell viability with the CCK-8 assay without or with 10 ng/mL Tβ4 treatment. (B) Detection of apoptotic cells by flow cytometry. Left: flow cytometry plots; right: quantitative analysis. (C) Detection of apoptotic cells with the TUNEL assay. Left: representative images (apoptotic cells are green and cell nuclei are blue); right: quantitative analysis. Data shown as mean ± SD. *P<0.05 vs control; #P<0.05 vs OGD/R.
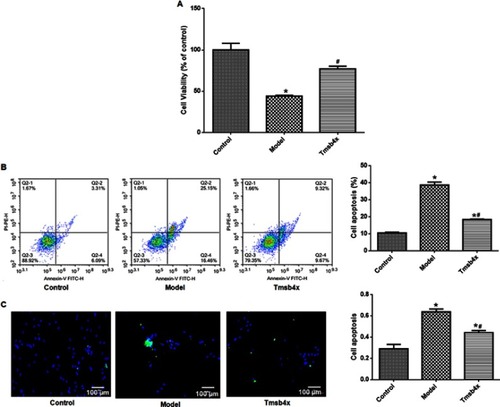
Figure 7 Exogenous Tβ4 reverses OGD/R-induced changes in ER and apoptosis-related protein expression. Upper panel: representative immunoblots; lower panel: quantitative analysis. Data shown as mean ± SD. *P<0.05 vs control; #P<0.05 vs OGD/R.