Figures & data
Figure 1 Flow diagram of the study.
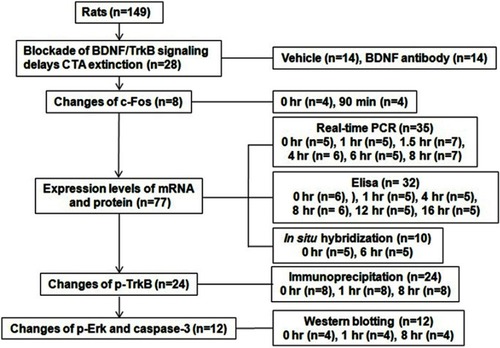
Figure 2 Effects of the BDNF antibody on CTA extinction in the IC. (A) The rats underwent bilateral microinfusion of the BDNF antibody or vehicle immediately after the CTA extinction test, and the extinction tests were performed for 4 consecutive days. (B) Measurement of the aversion index during the extinction training test after infusion of the BDNF antibody or vehicle in the IC (n=8 per group, *p<0.05, **p<0.01vs vehicle group). Arrows indicate drug microinfusion. (C) Placement of cannulae in the IC. (D) and (E) Western blotting was performed to detect the expression levels of c-Fos in the IC at 0 hr and 90 min after the second extinction test (n=4 per group, *p<0.05 vs 0 hr).
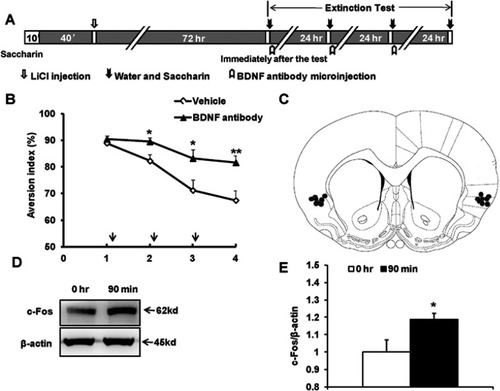
Figure 3 Temporal changes in neurotrophin expression in the IC after CTA extinction. (A) Real-time PCR detection of changes in the mRNA levels of BDNF in the IC during CTA extinction. The rats were sacrificed at 0 hr, 1 hr, 1.5 hr, 4 hr, 6 hr, or 8 hr after the second extinction test. The relative levels of BDNF mRNA normalized to those measure at 0 hr are shown (n=5–7 per group, *p<0.05, **p<0.01 vs 0 hr). (B) The levels of NGF mRNA (n=4 per group) did not significantly change after the extinction test in the IC as compared with 0 hr. (C) NT4 mRNA expression levels (n=4 per group) did not significantly change after extinction test in the IC as compared with 0 hr. (D) Temporal changes in the protein levels of BDNF in the IC during CTA extinction as evaluated by ELISA. The rats were sacrificed at 0 hr, 1 hr, 4 hr, 8 hr, 12 hr, or 16 hr after the second extinction test (n=5–6 per group, *p<0.05, **p<0.01 vs 0 hr).
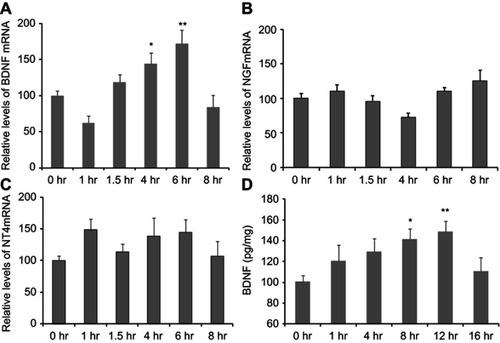
Figure 4 Increase in the levels of BDNF mRNA in the IC after CTA extinction by using in situ hybridization. The rats were killed at 0 or 6 hr after the second CTA extinction test. (A) Representative photomicrographs of rat brain sections depicting the mRNA levels of BDNF in the IC (Scale bar=500 μm). (B) Quantification of the mRNA levels of BDNF in the IC 6 hr after CTA extinction relative to those measured at 0 hr (n=5 per group, *p<0.05).
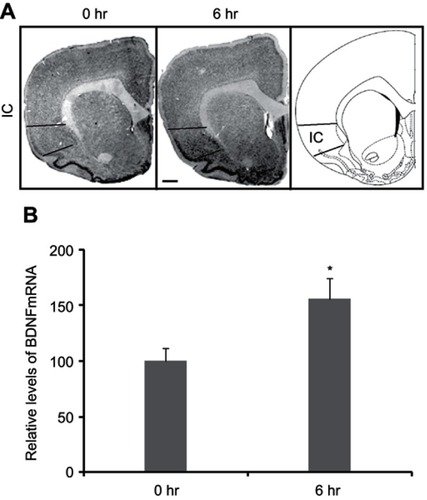
Figure 5 Changes in the levels of p-TrkB, p-Erk and caspase-3 in the IC after CTA extinction. (A) Protein lysates were subjected to immunoprecipitation (IP) with a rabbit anti-TrkB antibody followed by immunoblotting (IB) with a pY99 antibody (top). Immunoprecipitation of total TrkB was verified by immunoblotting with a mouse anti-TrkB antibody (second panel). TrkB in brian lysate was detected with a mouse anti-TrkB antibody (third panel) using Western blotting. The levels of TrkB in the total brain lysate were analyzed relative to those reported for α-tubulin. (B) The levels of immunoprecipitated p-TrkB relative to those of total TrkB at 1 and 8 hr after CTA extinction in the IC are presented as mean±SEM (n=8 per group, **p<0.01, *p<0.05 vs 0 hr). (C) The levels of p-Erk, total Erk and caspase-3 levels in the IC were detected in protein lysates through Western blotting. (D) The levels of p-Erk relative to those of total Erk and caspase-3 relative to β-actin at 1 and 8 hr after CTA extinction in the IC are presented as mean±SEM (n=4 per group, **p<0.01, *p<0.05 vs 0 hr).
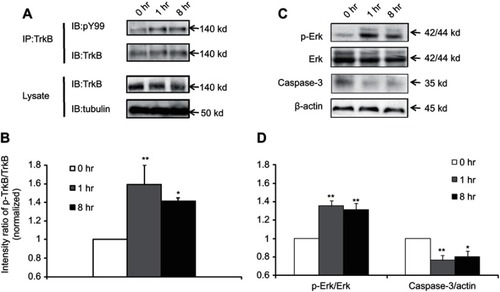
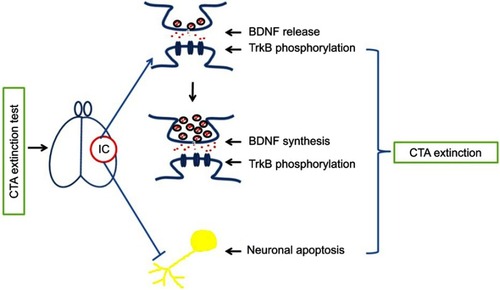
Figure 6 CTA extinction temporally induces the release of BDNF and inhibits neuronal apoptosis in the IC. CTA extinction induces activity-dependent BDNF secretion in the IC with subsequent activation of TrkB and BDNF synthesis, and inhibits neuronal apoptosis, thus mediating CTA extinction.