Figures & data
Table 1 Demographic Data and C-DECA-T T Scores
Table 2 Reliability Statistics of the C-DECA-T
Table 3 Mokken Scale Analysis of the C-DECA-T
Table 4 Pearson’s Correlations Between the Subscales of the C-DECA-T and Demographic Date, Child Behaviour Problems, and Parental Emotional Distress
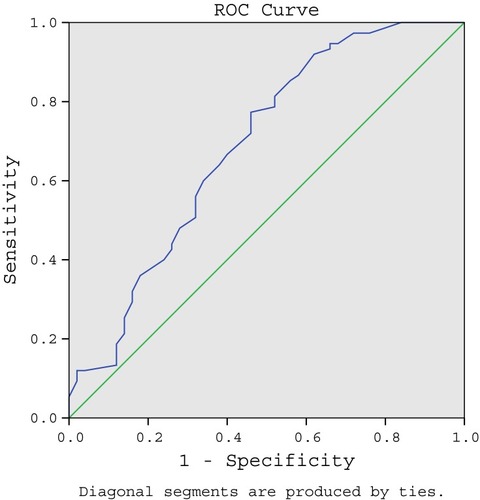
Figure 1 ROC curve of C-DECA-T.