Figures & data
Figure 1 Odds ratios and 95% CI for treatment response in randomized placebo-controlled trials for SSRI. Response based on CGI for all studies except for Liebowitz Social Anxiety ScaleCitation107 in van Vliet et al.Citation34 Only the highest ESC dose included for Lader et al.Citation26
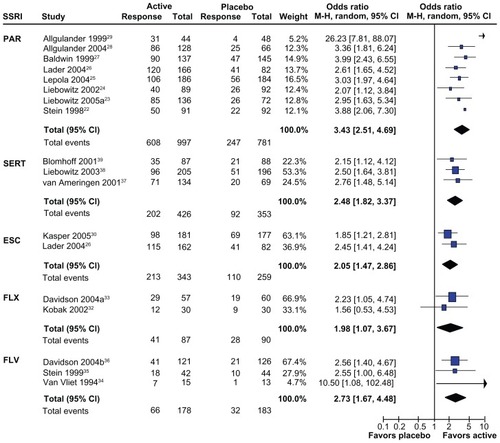
Figure 2 Odds ratios and 95% CI for treatment response in randomized placebo-controlled trials for the serotonin-norepinephrine reuptake inhibitor, venlafaxine. Response based on CGI for all studies.
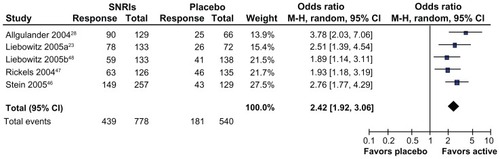
Figure 3 Odds ratios and 95% CI for treatment response in randomized placebo-controlled trials for irreversible and reversible MAOIs. Response based on CGI for all studies except social phobia subscale of the Fear QuestionnaireCitation108 for Gelernter et al,Citation53 and the Hamilton Anxiety ScaleCitation109 for van Vliet et al.Citation56
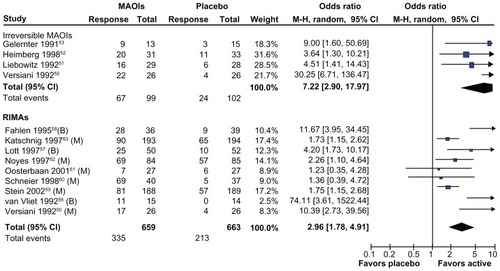
Figure 4 Odds ratios and 95% CI for treatment response in randomized placebo-controlled trials for the A2D ligands pregabalin (P) and gabapentin (G). Response based on CGI for all studies. Only the highest pregabalin doses are reported for Pande et alCitation73 and Feltner et al.Citation74
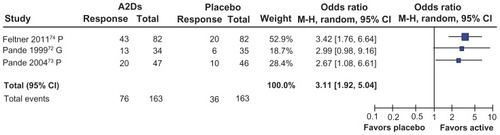
Figure 5 Odds ratios and 95% CI for treatment response in randomized placebo-controlled trials for five drug classes.
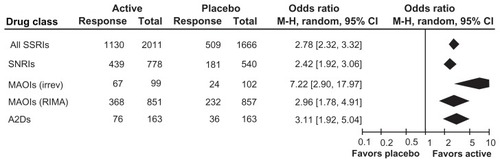
Figure 6 Odds ratios and 95% CI for treatment response in randomized placebo-controlled trials for drug versus psychotherapy comparisons. Blomhoff et alCitation39 used exposure therapy; all other trials used cognitive behavioral therapy as the psychotherapy intervention. Response based on Clinical Global Impression for all studies except social phobia subscale of the Fear QuestionnaireCitation108 for Gelernter et al,Citation53 and the Social Anxiety ScaleCitation107 for Heimberg et al.Citation52
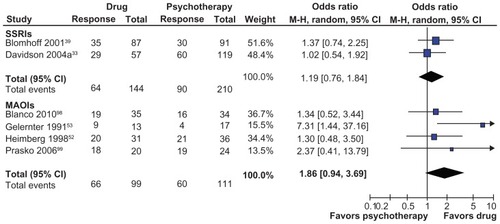
Figure 7 Odds ratios and 95% CI for treatment response in randomized placebo-controlled trials for medication compared with combined medication-psychological treatment. Blomhoff et alCitation39 used exposure therapy; Knijnik et alCitation100 used psychodynamic group therapy; all other trials used cognitive behavioral therapy as the psychotherapy intervention. Response based on Clinical Global Impression for all studies.
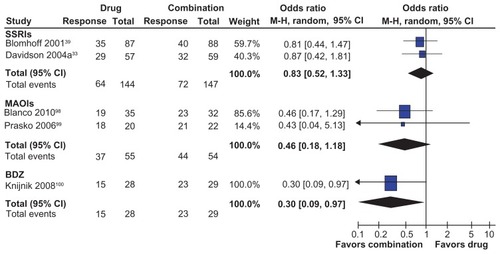
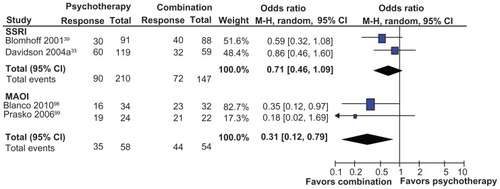
Figure 8 Odds ratios and 95% CI for treatment response in randomized placebo-controlled trials for psychological therapy compared with combined medication-psychological treatment. Blomhoff et alCitation39 used exposure therapy; all other trials used cognitive behavioral therapy as the psychotherapy intervention. Response based on Clinical Global Impression for all studies.