Figures & data
Table 1 Demographics (Total n=591)
Table 2 KMSK Scores: Maximal Exposure to Specific Substances
Table 3 Frequency and Fisher’s Exact Test of the Distribution of SERT Variants in Subjects with Opioid Dependence (OD) and Control Subjects (HC +NOD)
Figure 1 Cocaine KMSK scores in the whole cohort, by genotype. KMSK scores are on an ordinal integer scale, where “0” denotes no lifetime exposure (never used drug; see Methods), and greater scores denote increasing exposure (maximum score=16). Cocaine KMSK scores measure exposure at the point in a volunteer’s life when use was at its heaviest. A cocaine KMSK value ≥9 has optimal concurrent validity with a cocaine dependence diagnosis (DSM-IV criteria). Individual data points are shown in the scatter plot. The width of the data shown for each score is proportional to the number of subjects with that score. The red line shows the median score. The data were analyzed with a Mann–Whitney test (* denotes p=0.047).
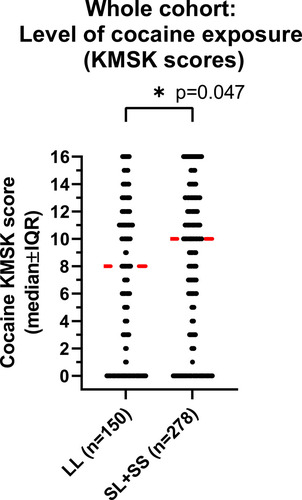
Figure 2 Contingency analysis in the whole cohort by tandem repeat genotype, for cocaine KMSK scores < or ≥ cutpoint (ie, for a score of 9) for the cocaine dependence diagnosis; see and .
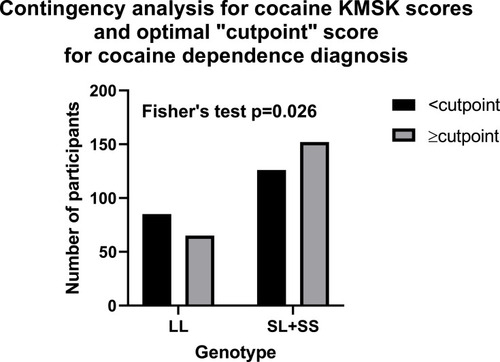
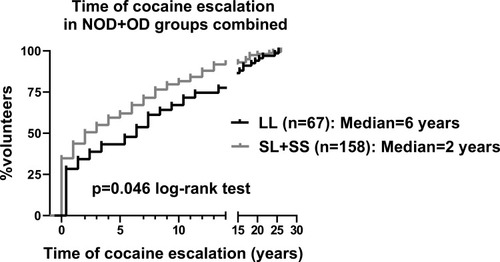
Figure 3 Kaplan–Meier survival curve for time of cocaine escalation by tandem repeat genotype, in the NOD+OD groups. Time of escalation is defined as: age of onset of heaviest use – age of first use (in years). Data are presented for all the volunteers in the NOD+OD groups who had cocaine escalation values. Values were analyzed with the log-rank (Mantel-Cox) test.