Figures & data
Table 1 Sample Distribution by Sex and Grade
Figure 1 Interactions between informant, school grade group, and sex.
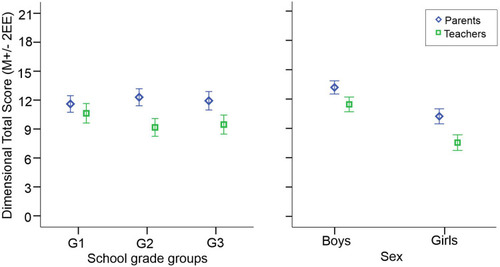
Table 2 Comparisons of Rater’s Results
Figure 2 Agree-plot. Number of children identified as meeting (ADHD) and not meeting (non-ADHD) criterion A for ADHD diagnosis (DSM-5Citation4), according to parents’ and teachers’ report. Black squares represent the number of cases reported in agreement, white areas represent discordant cases.
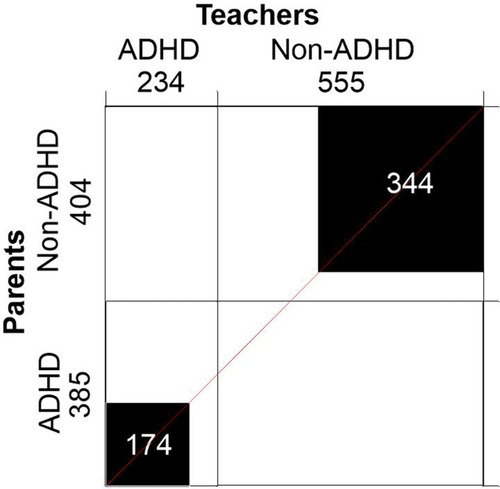
Table 3 Number of Questionnaires Delivered to and Recovered from Teachers, Classification According to Parent’s and Teachers’ Reports, and Inter-Rater Agreement, by School Grade
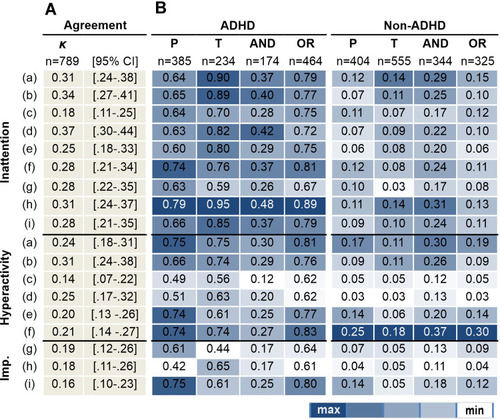
Figure 3 Analysis by symptoms in children meeting (ADHD) and not meeting (non-ADHD) criterion A for ADHD diagnosis (DSM-5Citation4). Columns show: (A) Inter-rater reliability coefficient (κ) for the entire sample, and (B) the frequency (in proportions) of children reported as having each symptom, by parents only (P), by teachers only (T), by both raters (AND), or by at least one (OR). In each column, the highest frequency (max) is in dark blue, and the lowest (min) in white.