Figures & data
Table 1 Data Retrieval Strategy for PubMed Database
Figure 1 Flow chart of study selection.
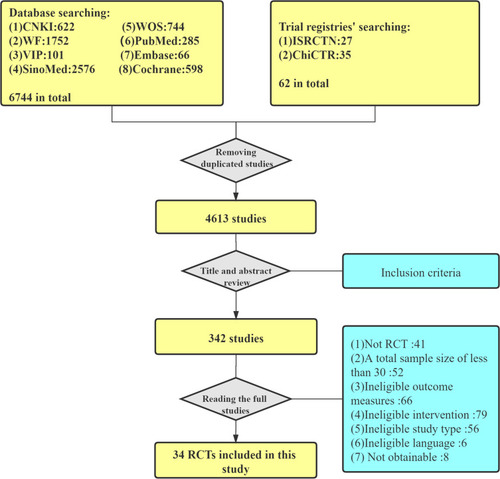
Figure 2 Risk of bias graph.
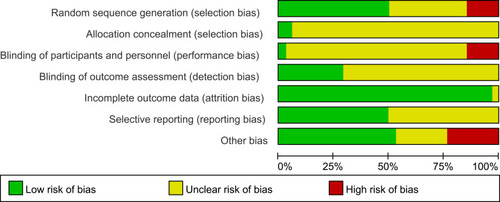
Figure 3 Risk of bias summary.
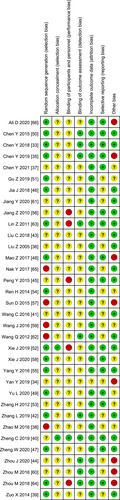
Table 2 The Results of Three Outcome Measures
Figure 4 Network plot of FMA-UE.
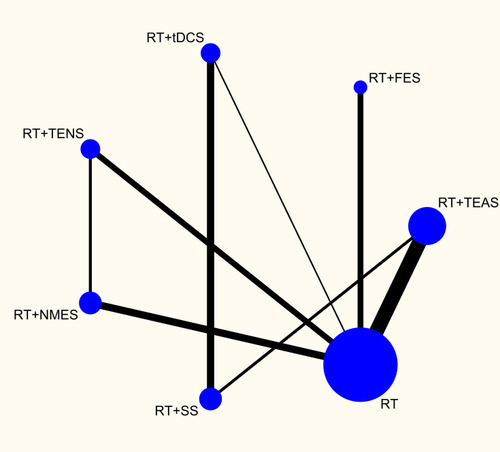
Figure 5 Network plot of MBI.
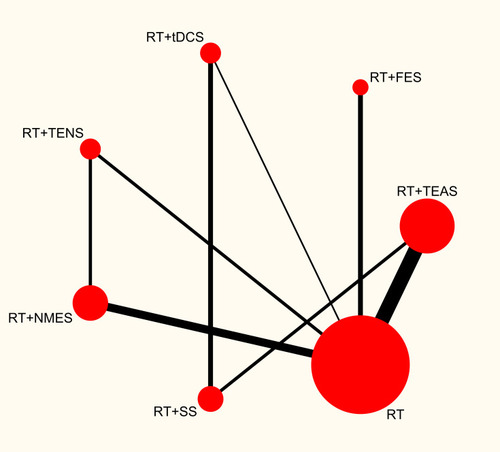
Figure 6 Network plot of MAS.
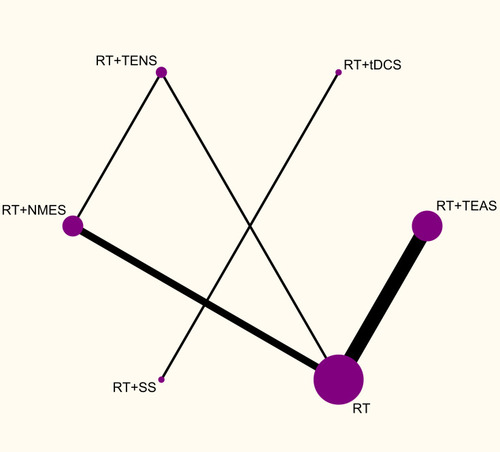
Figure 7 Network meta-analysis results for FMA-UE and MBI.
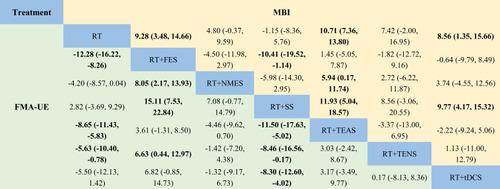
Figure 8 Network meta-analysis results for MAS.
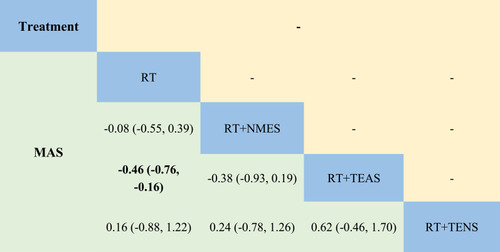
Figure 9 Ranking probability figure for reduction in FMA-UE.
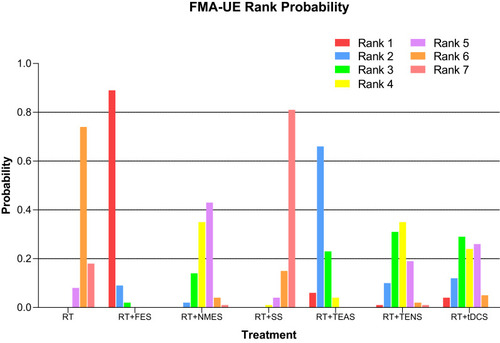
Figure 10 Ranking probability figure for reduction in MBI.
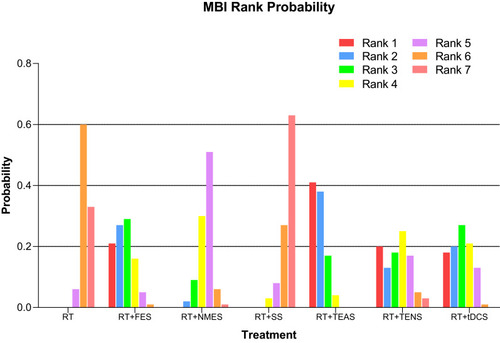
Figure 11 Ranking probability figure for reduction in MAS.
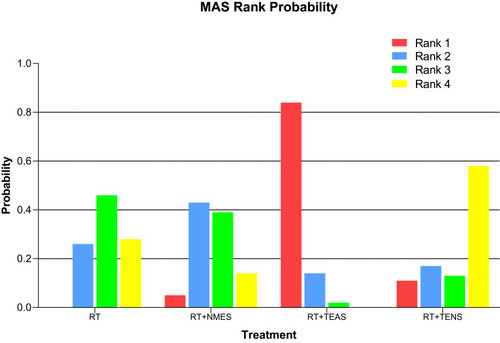
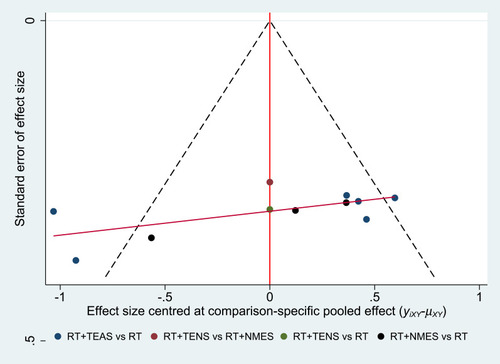
Figure 12 Funnel plot for the network meta-analysis of reduction in FMA-UE.
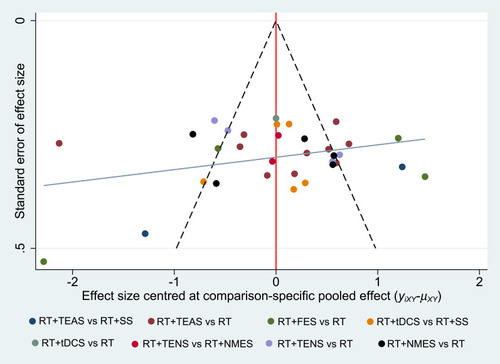
Figure 13 Funnel plot for the network meta-analysis of reduction in MBI.
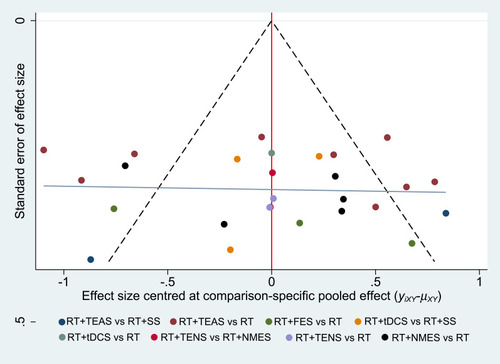
Figure 14 Funnel plot for the network meta-analysis of reduction in MAS.