Figures & data
Figure 1 Effects of JDYZF on the levels of weight and diet. (A) Weight; (B) Diet. *p < 0.05, ****p < 0.01 compared with the CG; #p < 0.05, ##p < 0.01 compared with the LG, (B) F = 12.12, N=6.
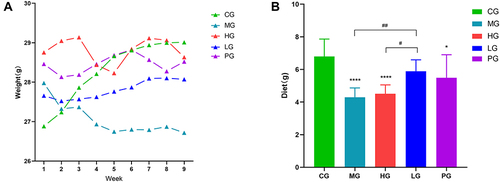
Figure 2 Oral administration of JDYZF rescues cognitive deficits in APP/PS1 mice. (A) Escape latency; (B) Probe trial time in the quadrant; (C) Probe trial number of times crossing platforms; (D) Representative swimming trajectories of different groups of mice after removing the platform. (a) CG; (b) MG; (c) HG; (d) LG; (e) PG. The results were shown as mean ± SEM or representative pictures. Data in panels were analyzed by one-way ANOVA. *p < 0.05, **p or ***p < 0.01 compared with the CG; #p < 0.05 compared with the MG, (B) F = 8.447, (C) F = 10.56. N = 6.
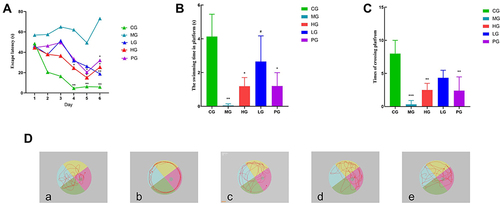
Figure 3 Representative histopathological and immunohistochemical photos of hippocampal CA1 area tissue sections from each group. (A) Histological examinations were performed in the hippocampal CA1 area tissue. The scale bar was 100 μm; (B) Levels of p-tau were measured by immunohistochemical method. The scale bar was 100 μm; (C) Quantitative analysis of p-tau. (a) CG; (b) MG; (c) HG; (d) LG; (e) PG. **p < 0.01, ***p < 0.01 compared with the MG, F = 15.09, N = 3.
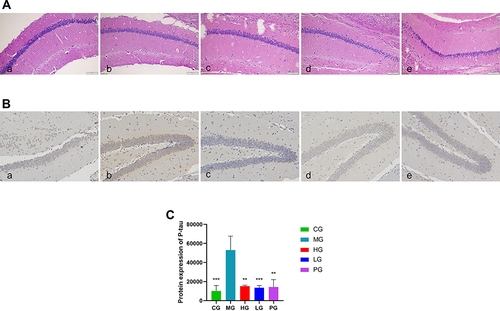
Figure 4 OTUs-based Venn diagram.
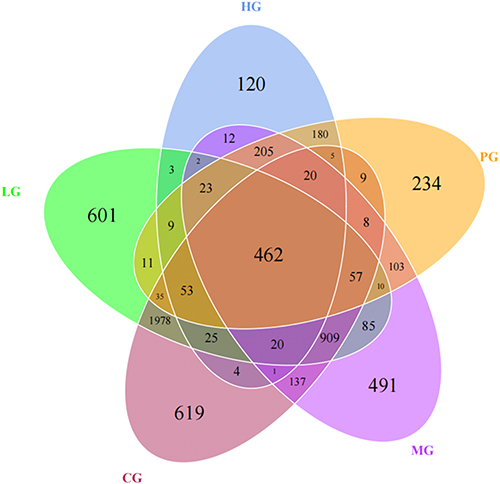
Figure 5 Alpha and beta diversity. (A) Observed_species; (B) chaos analysis (Wilcoxon test); (C) PCoA (weighted).
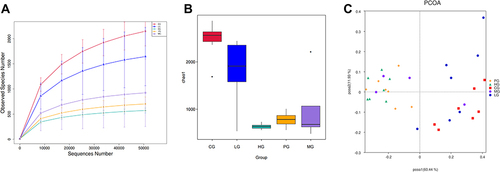
Figure 6 Boxplot of main differential bacteria relative abundance. Horizontal lines represent the difference between the groups. *Indicates significant difference between the two groups (p value <0.05). **Indicates the difference between the two groups was significant (p value <0.01).
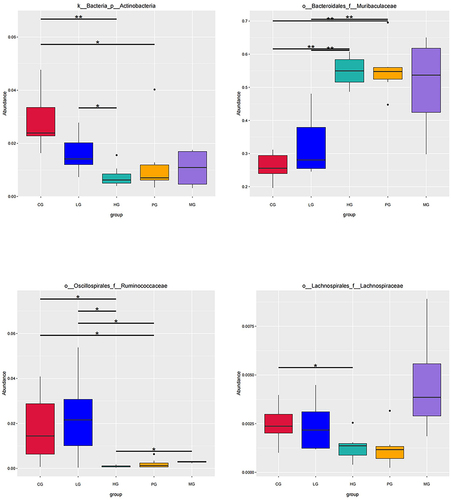
Figure 7 (A) The Western blot assay images for the levels of TLR4 in APP/PS1 mice. (B) The Western blot assay images for the levels of p-iκBiκB, p-p65, p65, and IL-1β in APP/PS1 mice. (C) The protein level of TLR4, p-iκB/iκB, p-p65/p65, and IL-1β in JDYZF-treated APP/PS1 mice were measured by Western blot assay. *p < 0.05, **p or ***p or ****p < 0.01 compared with the MG, #P < 0.05 compared with HG. F = 10.91, F = 10.93, F = 23.53, F = 14.46. N = 3 in each group.
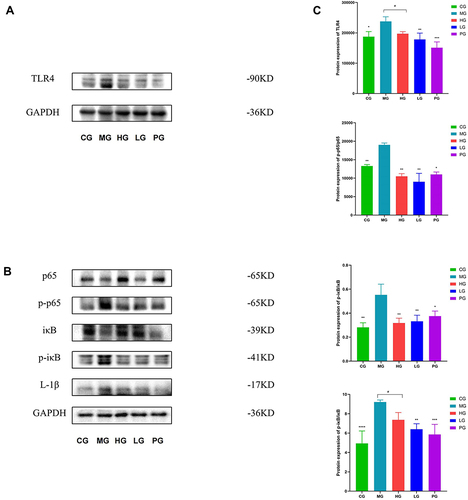
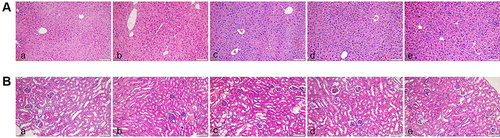
Figure 8 Histopathological changes in each group. (A) Pathological tissue of APP/PS1 mice liver; (B) pathological tissue of APP/PS1 mice kidney. (a) CG; (b) MG; (c) HG; (d) LG; (e) PG. (HE staining, ×200).