Figures & data
Figure 1 High expression of VSIG4 in GBM. (A) VSIG4 was overexpressed in GBM tumor tissues by analysis in the GEPIA database; (B) VSIG4 expression was significantly different in different grades of GBM by analysis in the GlioVis database; (C). RT-qPCR was used to detect the expression of VSIG4 in HEB, U251 and LN299 cells. RT-qPCR assay was repeated 5 times.
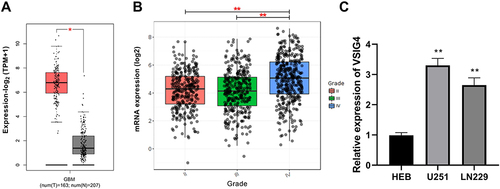
Figure 2 VSIG4 silencing inhibits the viability, migration and invasion of GBM. (A) Detection of VSIG4 silencing efficiency by RT-qPCR in U251 and LN229 cells, which were untreated and transfected with siNC, siVSIG41-1, and siVSIG41-2; (B) Detection of cell viability by CCK-8 assay in U251 and LN229 cells; (C) Detection of cell migration by scratch test in U251 and LN229 cells; (D) Detection of cell invasion by transwall assay in U251 and LN229 cells. Scale bar for U251 cells was 100μm, and scale bar for LN229 cells was 50μm. CCK-8 assay was repeated 4 times, and scratch test and transwall assays were repeated 3 times, respectively.
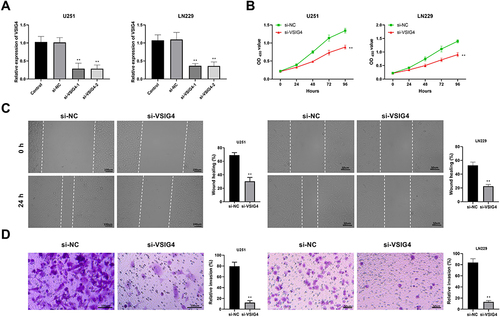
Figure 3 VSIG4 silencing promotes pyroptosis of GBM. (A) VSIG4 silencing influenced the protein expression levels of pyroptosis markers, including NLRP3, caspase-1, and GSDMD in the Western blot assay; (B) VSIG4 silencing influenced the concentration levels of pyroptosis-related inflammatory factors, including IL-18, IL-1β, and TNF-α in the ELISA assay. Western blot and ELISA assays were repeated 3 times, respectively.
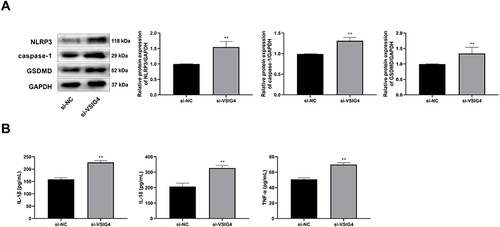
Figure 4 The exhibition of DEGs of transcriptome sequencing. (A) Volcano plot of the DEGs regulated by VSIG4. Red dots represent genes with high expression, blue dots represent genes with low expression, and black dots represent genes with no difference in expression level; (B) The heatmap displayed the DEGs variation modulated by VSIG4.
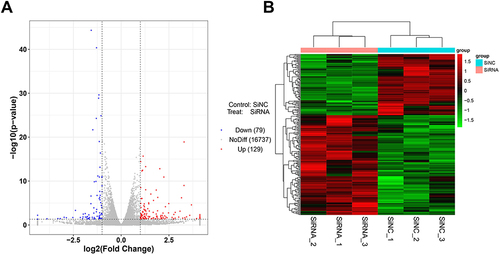
Figure 5 GO and KEGG analysis of DEGs regulated by VSIG4. (A) A bar chart of GO analysis for DEGs; (B) A bubble plot of GO analysis for DEGs; (C) A bar diagram of KEGG analysis for DEGs; (D) A bubble diagram of KEGG analysis for DEGs.
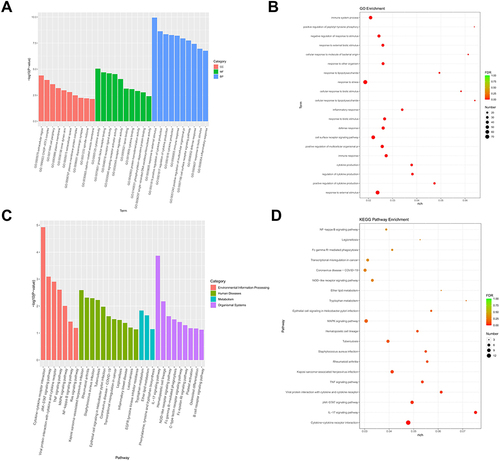
Figure 6 WB validation of JAK2/STAT3 pathway-related proteins, including p-JAK2, JAK2, p-STAT3, and STAT3. Western blot assay was repeated 3 times.
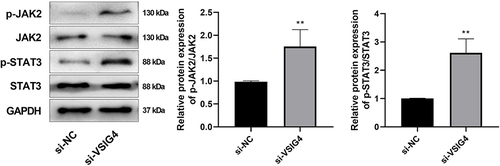
Figure 7 VSIG4 could regulate JAK2/STAT3 pathway to promote GBM viability, migration and invasion. (A) Detection of cell viability by CCK-8 in si-NC, si-VSIG4, and si-VSIG4+AG490 groups; (B) Detection of cell migration in si-NC, si-VSIG4, and si-VSIG4+AG490 groups by scratch assay; (C) Detection of cell invasion in si-NC, si-VSIG4, and si-VSIG4+AG490 groups by transwall assay. The scale bar was 100μm. CCK-8 assay was repeated 4 times, and scratch test and transwall assay were repeated 3 times, respectively.
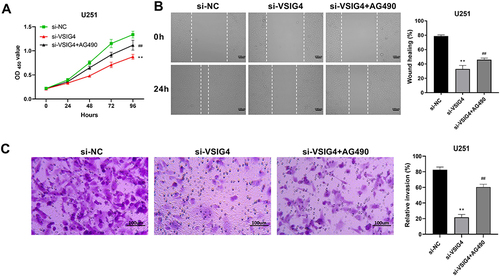
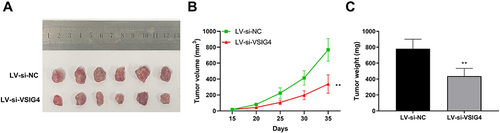
Figure 8 Knockdown of VSIG4 inhibits GBM tumor growth in vivo. (A) Representative images of tumors in the LV-si-NC and LV-si-VSIG4 groups; (B) Tumor volume growth curve in the LV-si-NC and LV-si-VSIG4 groups; (C) Tumor weight histogram in the LV-si-NC and LV-si-VSIG4 groups. Tumor volume and weight measurements were repeated 6 times, respectively.